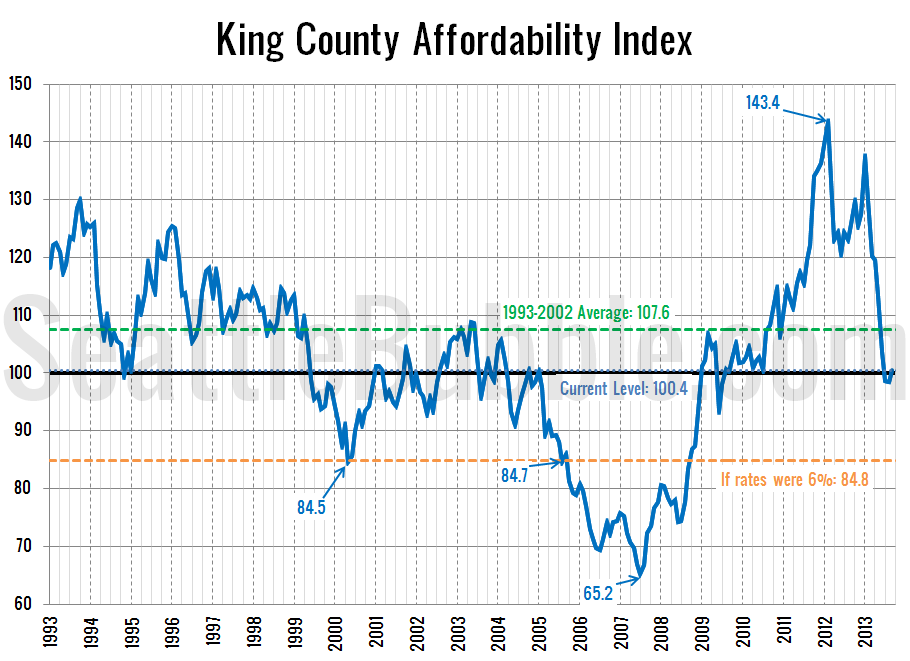
Let’s take a look at how affordability is doing in the Seattle area after the last couple months of changes in home prices and interest rates. So how does affordability look as of September? Slightly better. The index inched back above 100 (i.e. the median-priced home is affordable to a median-income household) thanks to the…
Tag: big-picture
Median Home Prices Inch Above “Affordable Home” Price
As promised in last week’s affordability post, here’s an updated look at the “affordable home” price chart. In this graph I flip the variables in the affordability index calculation around to other sides of the equation to calculate what price home the a family earning the median household income could afford to buy at today’s…
Affordability Index Falls Below 100, Hits 4-Year Low
As volatile as interest rates and home prices have both been this year, I thought it would be good to make the affordability index more of a regular post. So how does affordability look as of July? Not great. The index fell below 100 (i.e. the median-priced home is affordable to a median-income household) for…
Interest Rate & Price Increases Quickly Killing Affordability
With the dramatic increase in mortgage interest rates that we’ve seen over the last few weeks, I thought that it now would be a good time to take another look at what the affordability numbers look like. As a reminder, the affordability index is based on three factors: median single-family home price as reported by…
Seattle-Area Price to Income Ratio Near Historic Average
It’s been a while since we’ve taken look at how local home prices compare to local incomes, so let’s update those charts. First, let’s check out the ratio between home prices and per capita income from the BEA: Overall the Seattle area is just a little bit above the long-term average, and almost entirely thanks…