Skip to content

Seattle Bubble

local real estate news, statistics, and commentary without the sales spin.

Menu
  • Home
  • About
  • Contact
  • Reference
  • Speaking
Menu

Tag: Case-Shiller

Case-Shiller: Home Prices Slip Further Into Fall

Posted on November 25, 2014November 25, 2014 by The Tim

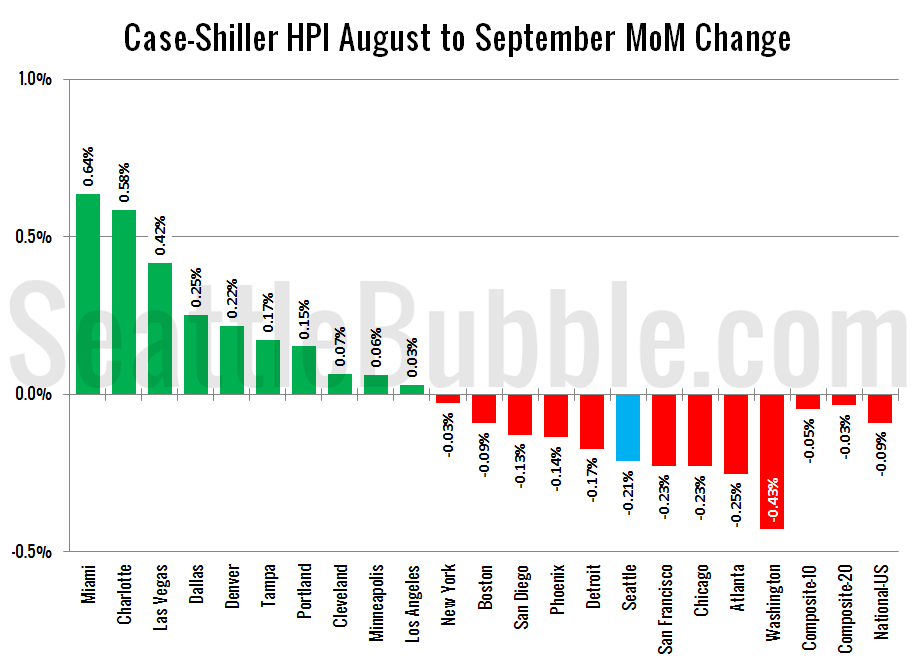
Let’s have a look at the latest data from the Case-Shiller Home Price Index. According to September data, Seattle-area home prices were: Down 0.2% August to September Up 6.0% YOY. Down 11.3% from the July 2007 peak Last year at this time prices were still rising. They increased 0.3% from August to September and year-over-year…

Share:

  • Twitter
  • LinkedIn
  • Facebook
  • Reddit
  • Pinterest
  • Email

Price Gains Shrinking in All Twenty Case-Shiller Cities

Posted on October 30, 2014October 30, 2014 by The Tim

It’s been a few months since we last had a look at my favorite alternative Case-Shiller charts. First up, let’s have a look at the chart that depicts the count of cities showing second derivative (month-over-month changes in the year-over-year changes) gains or losses. For the last three months of data, every single city has…

Share:

  • Twitter
  • LinkedIn
  • Facebook
  • Reddit
  • Pinterest
  • Email

Case-Shiller Tiers: High Tier Leads Autumn Decline

Posted on October 29, 2014October 29, 2014 by The Tim

Let’s check out the three price tiers for the Seattle area, as measured by Case-Shiller. Remember, Case-Shiller’s “Seattle” data is based on single-family home repeat sales in King, Pierce, and Snohomish counties. Note that the tiers are determined by sale volume. In other words, 1/3 of all sales fall into each tier. For more details…

Share:

  • Twitter
  • LinkedIn
  • Facebook
  • Reddit
  • Pinterest
  • Email

Case-Shiller: Seattle Home Prices Begin the Autumn Decline Earlier Than Last Year

Posted on October 28, 2014 by The Tim

Let’s have a look at the latest data from the Case-Shiller Home Price Index. According to August data, Seattle-area home prices were: 0.0% Change July to August Up 6.6% YOY. Down 11.1% from the July 2007 peak Last year at this time prices were still rising. They increased 0.5% from July to August and year-over-year…

Share:

  • Twitter
  • LinkedIn
  • Facebook
  • Reddit
  • Pinterest
  • Email

Case-Shiller Tiers: Year-Over-Year Gains Continue to Shrink

Posted on October 3, 2014 by The Tim

Let’s check out the three price tiers for the Seattle area, as measured by Case-Shiller. Remember, Case-Shiller’s “Seattle” data is based on single-family home repeat sales in King, Pierce, and Snohomish counties. Note that the tiers are determined by sale volume. In other words, 1/3 of all sales fall into each tier. For more details…

Share:

  • Twitter
  • LinkedIn
  • Facebook
  • Reddit
  • Pinterest
  • Email

Posts navigation

  • Previous
  • 1
  • …
  • 12
  • 13
  • 14
  • 15
  • 16
  • 17
  • 18
  • …
  • 58
  • Next

Tim’s Other Projects

Dispatches from the Multiverse

Tip Jar

Like what we're doing?

Drop us a tip!

Accounts

  • Log in
  • Entries feed
  • Comments feed
  • WordPress.org
©2024 Seattle Bubble | Built using WordPress and Responsive Blogily theme by Superb