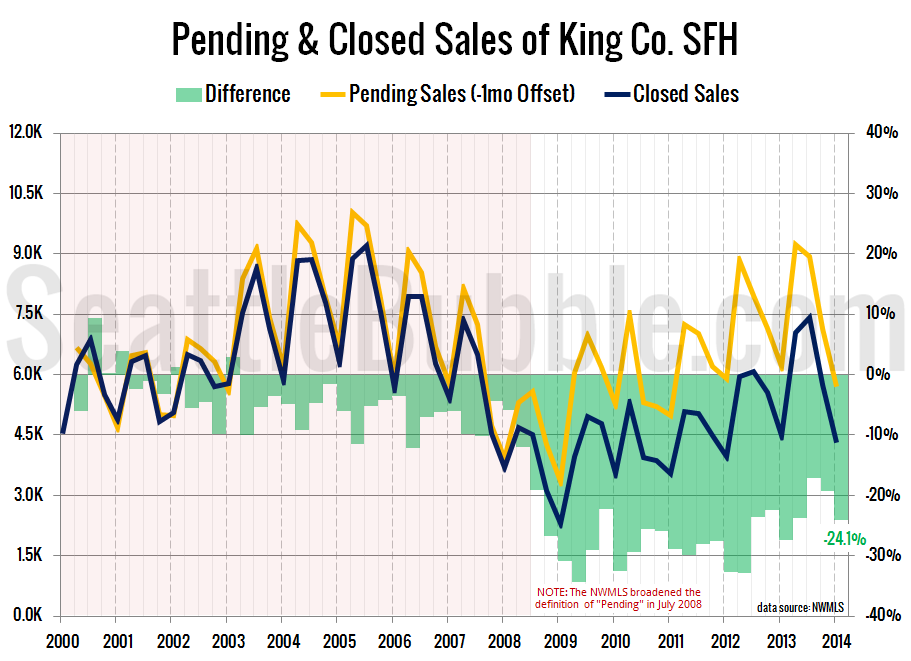
Let’s take a look a the latest data on pending sales volume versus closed sales volume. For this series I roll the pending sales and closed sales data up by quarter, with pending sales offset by one month. In other words, the first quarter numbers below represent pending sales from December, January, and February and…
Tag: graphs
Case-Shiller: Home Prices Slip Further in January
Let’s have a look at the latest data from the Case-Shiller Home Price Index. According to January data, Seattle-area home prices were: Down 0.8% December to January Up 11.9% YOY. Down 17.8% from the July 2007 peak Last year prices fell 0.3% from December to January and year-over-year prices were up 8.7%. Home prices in…
Around the Sound: Sales & Listings Moderated in February
It’s time for us to check up on stats outside of the King/Snohomish core with our “Around the Sound” statistics for Pierce, Kitsap, Thurston, Island, Skagit, and Whatcom counties. If there is certain data you would like to see or ways you would like to see the data presented differently, drop a comment below and…
Case-Shiller: Home Prices End 2013 On a Dip
Let’s have a look at the latest data from the Case-Shiller Home Price Index. According to December data, Seattle-area home prices were: Down 0.5% November to December Up 12.4% YOY. Down 17.2% from the July 2007 peak Last year prices fell 0.5% from November to December and year-over-year prices were up 8.2%. Home prices in…
Around the Sound: Prices Slip in Thurston & Kitsap
It’s time for us to check up on stats outside of the King/Snohomish core with our “Around the Sound” statistics for Pierce, Kitsap, Thurston, Island, Skagit, and Whatcom counties. If there is certain data you would like to see or ways you would like to see the data presented differently, drop a comment below and…