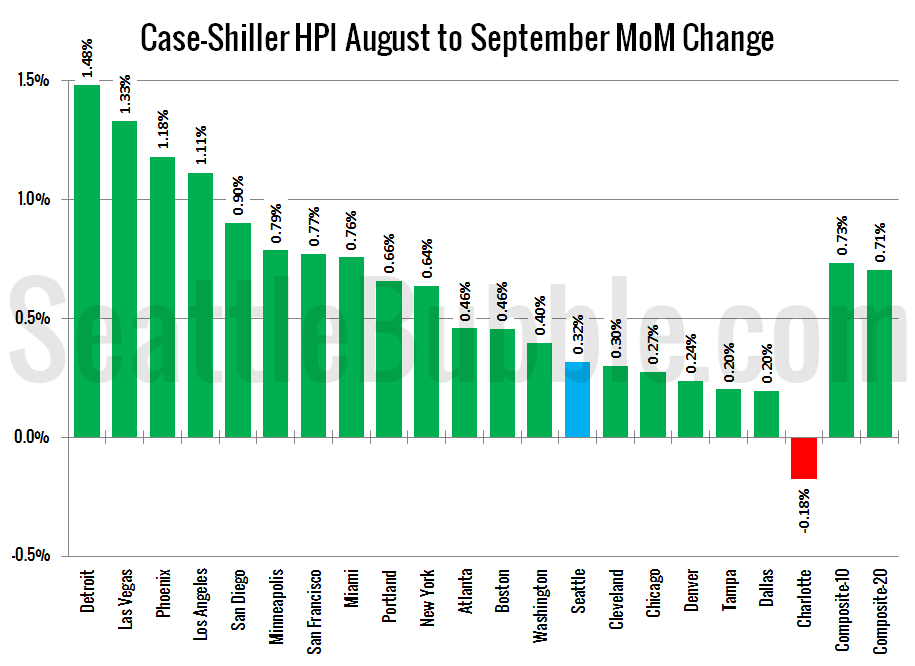
Let’s have a look at the latest data from the Case-Shiller Home Price Index. According to September data, Seattle-area home prices were: Up 0.3% August to September Up 13.2% YOY. Down 16.3% from the July 2007 peak Last year prices rose 0.3% from August to September and year-over-year prices were up 4.8%. Nothing really noteworthy…
Tag: graphs
Fewer Pending Sales Failed to Close in Q3
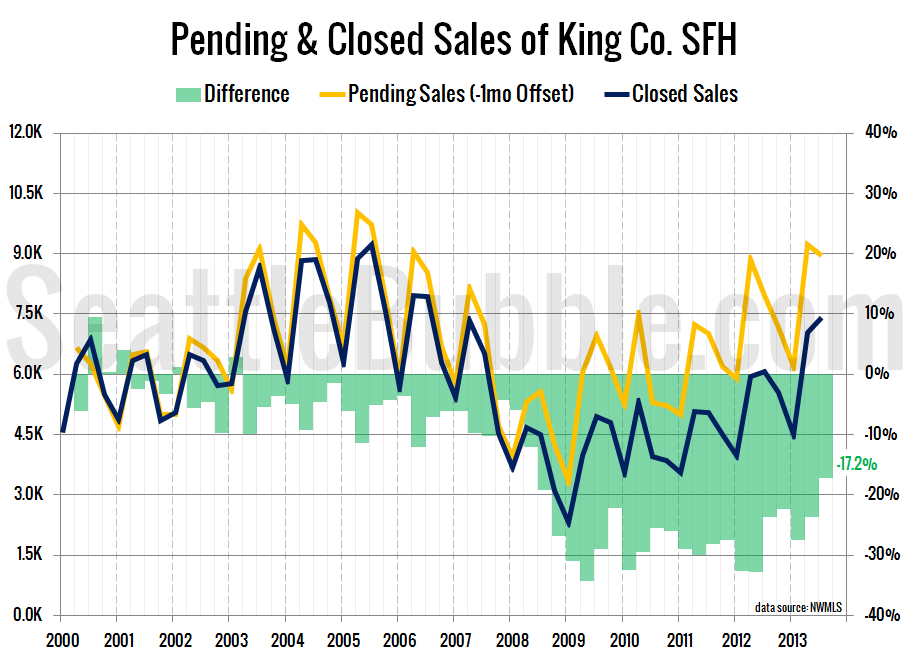
Let’s take a look a the latest data on pending sales volume versus closed sales volume. For this series I roll the pending sales and closed sales data up by quarter, with pending sales offset by one month. In other words, the third quarter numbers below represent pending sales from June, July, and August and…
Seattle Price Gains Slowest of Case-Shiller Cities in August
Let’s have a look at the latest data from the Case-Shiller Home Price Index. According to August data, Seattle-area home prices were: Up 0.5% July to August Up 13.2% YOY. Down 16.6% from the July 2007 peak Last year prices fell 0.1% from July to August and year-over-year prices were up 3.4%. Although the month-over-month…
Around the Sound: Snohomish County Inventory Shoots Up
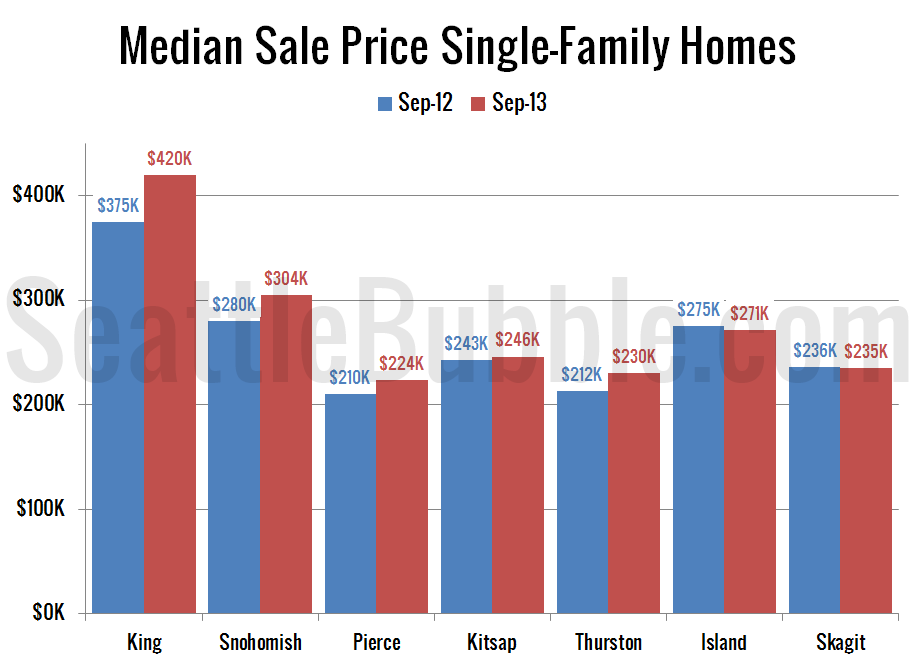
It’s time for us to check up on stats outside of the King/Snohomish core with our “Around the Sound” statistics. If there is certain data you would like to see or ways you would like to see the data presented differently, drop a comment below and let me know. First up, a summary table: September…
Case-Shiller: Seattle Home Price Gains Increased in July
Let’s have a look at the latest data from the Case-Shiller Home Price Index. According to June data, Seattle-area home prices were: Up 1.9% June to July Up 12.5% YOY. Down 17.1% from the July 2007 peak Last year prices rose 1.4% from June to July and year-over-year prices were up 3.1%. After slowing down…


