It’s been quite a while since we last had a look at the percentage of pending sales that turn into closed sales, so let’s refresh that chart and take a look a the latest data. This particular series is fairly noisy when you look at it with monthly granularity, so for this post I’ve rolled…
Tag: graphs
Case-Shiller: Home Price Growth Slowed Slightly in June
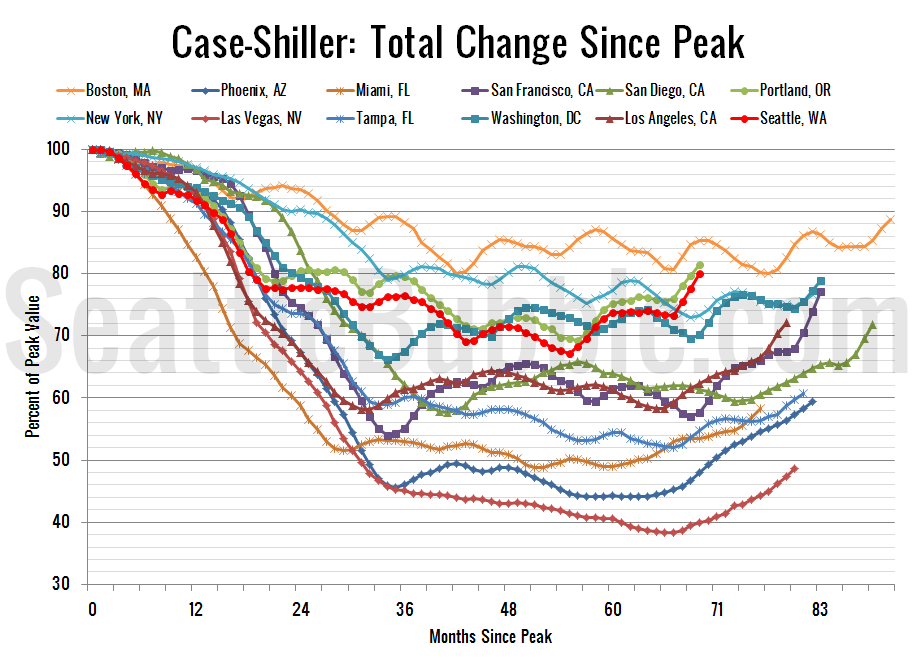
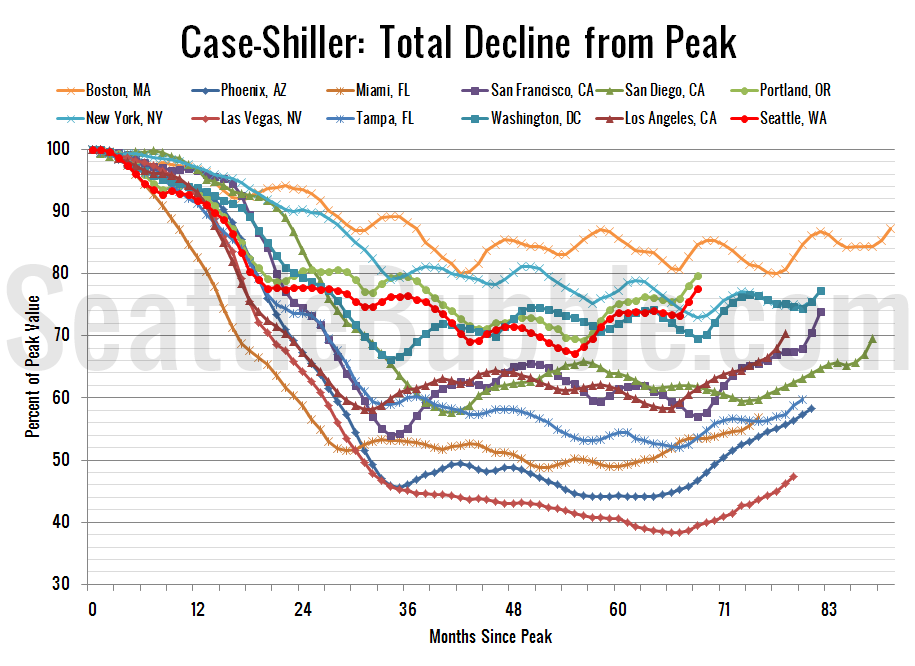
Let’s have a look at the latest data from the Case-Shiller Home Price Index. According to June data, Seattle-area home prices were: Up 1.8% May to June Up 11.8% YOY. Down 18.6% from the July 2007 peak Last year prices rose 1.8% from May to June and year-over-year prices were up 1.8%. Note that the…
Around the Sound: Pierce & Skagit Lead Price Gains
It’s been quite a long time since we updated any of our charts with data from outside King and Snohomish counties. Let’s revisit the “Around the Sound” statistics. Since it’s been so long, I’m starting over from scratch with the format of this post. If there is certain data you would like to see or…
Case-Shiller: Seattle’s Spring Surge Continues
Let’s have a look at the latest data from the Case-Shiller Home Price Index. According to May data, Seattle-area home prices were: Up 3.1% April to May Up 11.9% YOY. Down 20.1% from the July 2007 peak Last year prices rose 2.6% from April to May and year-over-year prices were up 0.6%. Still no surprises,…
Case-Shiller: Seattle Home Prices Jumped Again in April
Let’s have a look at the latest data from the Case-Shiller Home Price Index. According to March data, Seattle-area home prices were: Up 2.7% March to April Up 11.4% YOY. Down 22.5% from the July 2007 peak Last year prices rose 2.0% from March to April and year-over-year prices were down 1.0%. Nothing surprising about…


