This poll was active 02.23.2014 through 03.01.2014
Tag: Interest Rates

Affordable Home Price on Par with Median Price
As promised in yesterday’s affordability post, here’s an updated look at the “affordable home” price chart. In this graph I flip the variables in the affordability index calculation around to other sides of the equation to calculate what price home the a family earning the median household income could afford to buy at today’s mortgage…

Affordability: Price Declines Offset by Increasing Rates
Let’s take a look at how affordability is doing in the Seattle area after the last couple months of changes in home prices and interest rates. So how does affordability look as of January? Roughly the same place it’s been bouncing around since last June. The index inched back up to 103.6 from 100.8 in…

Interest Rates Dip, Consumer Confidence Climbs
Let’s check in on how Consumer Confidence and mortgage interest rates fared during January. First up, here’s the Consumer Confidence data as of November: At 79.1, the Present Situation Index increased 5% between December and January, and is up 41% from a year earlier. The Present Situation Index is currently up 292% from its December…
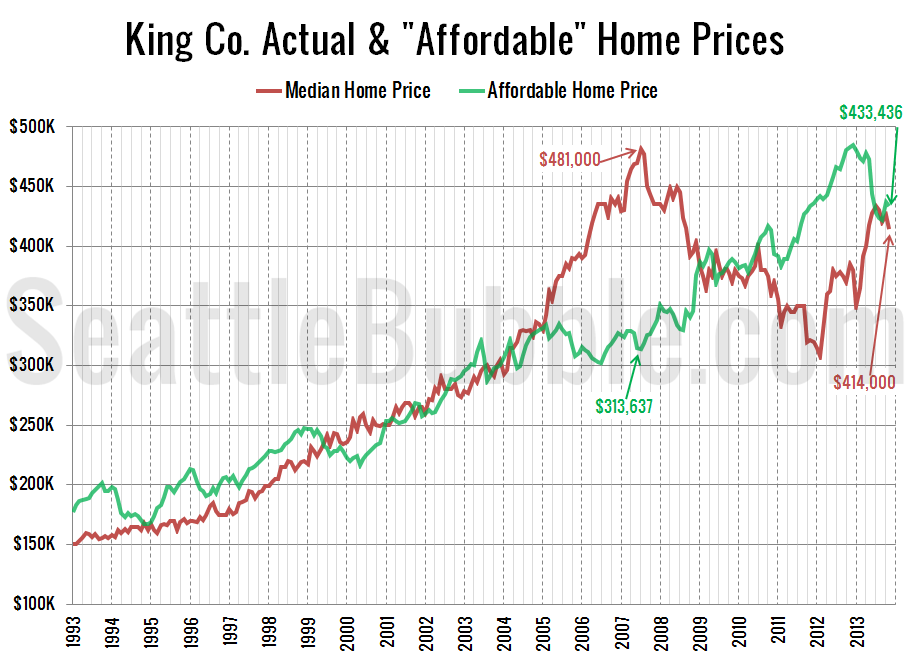
Median Price Drops Back Below Affordable Home Price
As promised in yesterday’s affordability post, here’s an updated look at the “affordable home” price chart. In this graph I flip the variables in the affordability index calculation around to other sides of the equation to calculate what price home the a family earning the median household income could afford to buy at today’s mortgage…