Let’s take an updated look at how King County’s sales are shifting between the different regions around the county, since geographic shifts can and do affect the median price. In order to explore this concept, we break King County down into three regions, based on the NWMLS-defined “areas”: low end: South County (areas 100-130 &…
Tag: NWMLS
Reporting Roundup: Unique Greedy Frenzy Edition
It’s time once again for the monthly reporting roundup, where you can read my wry commentary about the news instead of subjecting yourself to boring rehashes of the NWMLS press release (or in addition to, if that’s what floats your boat). To kick things off, here’s an excerpt from the NWMLS press release: Northwest MLS…
NWMLS: 2012 Ends on a Sour Note for Buyers
December market stats were published by the NWMLS this morning. Here’s a snippet from their press release: Northwest MLS Tallies Busy December as First-time Buyers, Investors Return. Brokers expect the housing market rebound to continue, while cautioning sellers to refrain from becoming too greedy and expressing hope for “controlled natural growth” to sustain the recovery….
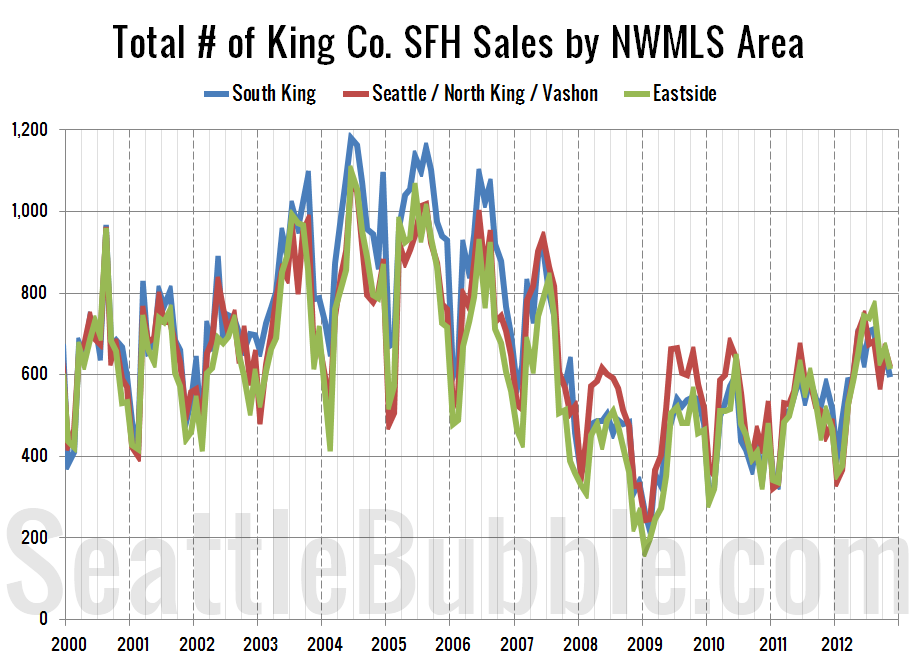
Eastside Prices Stall; Seattle & South King Gain Ground
Let’s take an updated look at how King County’s sales are shifting between the different regions around the county, since geographic shifts can and do affect the median price. In order to explore this concept, we break King County down into three regions, based on the NWMLS-defined “areas”: low end: South County (areas 100-130 &…
Chart Request: Median Price & Inventory Since the Peak
Here’s a chart request that was submitted by a user via the blue “submit ideas” button on the bottom-right corner of the page: I would like a chart similar to the CSI price since peak chart with base 100. However, this chart would plot and contrast your Seattle median price since peak against the King…