Before we put away the Case-Shiller data for another month, let’s check in on a few of our alternative charts. First up, let’s take a look at the twenty-city month-over-month scorecard. Here’s the original post introducing this chart if you’d like more details. I think it’s worth noting that June marks the first time since…
Tag: quant
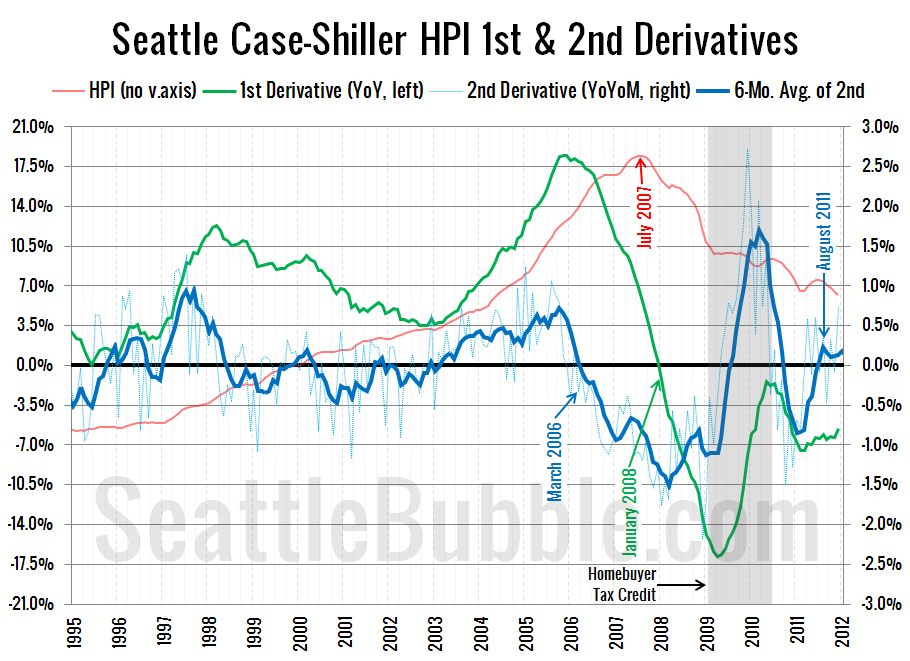
Home Price Second Derivative Continues to Increase
Before we put away the Case-Shiller data for another month, let’s check in on the second derivative. For an introduction to this particular view, hit the original post from March. First up, the plot of both the first derivative (year over year changes) and the second derivative (month over month changes in the year over…
Second Derivative Suggests Imminent Price Stabilization
At the risk of getting a little too technical and going off the quant deep end, I wanted to explore a different view of the Case-Shiller home price data that I haven’t shared on here before. Typically when we look at the Case-Shiller home price data on here, we look at three things: The raw…