Skip to content

Seattle Bubble

local real estate news, statistics, and commentary without the sales spin.

Menu
  • Home
  • About
  • Contact
  • Reference
  • Speaking
Menu

Tag: sales

February Stats Preview: Not a Preview Edition

Posted on March 15, 2013 by The Tim

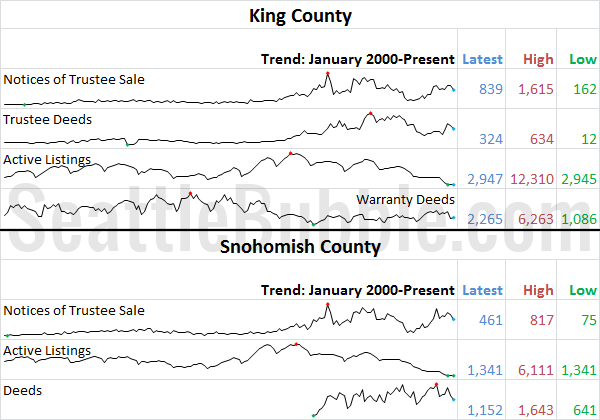
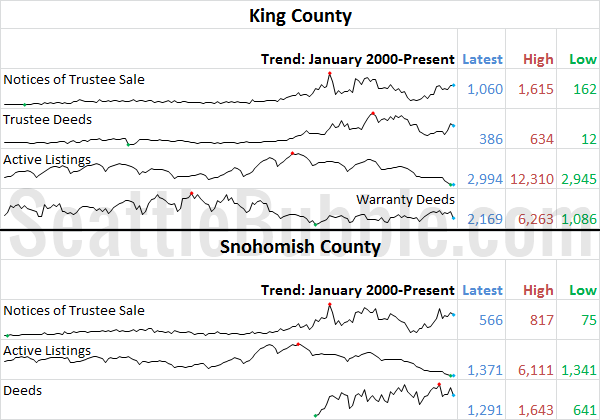
We missed posting this on time at the beginning of the month, but by request, we’re going to have a look at our stats preview. Most of the charts below are based on broad county-wide data that is available through a simple search of King County and Snohomish County public records. If you have additional…

Share:

  • Twitter
  • LinkedIn
  • Facebook
  • Reddit
  • Pinterest
  • Email

Expensive Home Sales Dropped Off Dramatically in January

Posted on February 19, 2013February 19, 2013 by The Tim

Let’s have another look at our monthly sales histogram. After flattening out somewhat between November and December the sales distribution curve became much steeper in January as sales above $300,000 fell off dramatically. In December the mode (i.e. the bucket with the most sales) for non-distressed sales was at $350,000 to $400,000, but in January…

Share:

  • Twitter
  • LinkedIn
  • Facebook
  • Reddit
  • Pinterest
  • Email

January Stats Preview: Inventory Inching Up Edition

Posted on February 4, 2013 by The Tim

Now that we’ve got a full month of 2013 under our belt, let’s have a look at our stats preview. Most of the charts below are based on broad county-wide data that is available through a simple search of King County and Snohomish County public records. If you have additional stats you’d like to see…

Share:

  • Twitter
  • LinkedIn
  • Facebook
  • Reddit
  • Pinterest
  • Email

Cheap Home Sales Picked Up Some Steam in December

Posted on January 25, 2013 by The Tim

Let’s have another look at our monthly sales histogram. The sales distribution curve flattened out a bit between November and December, with low-priced homes inching up and many of the high-price buckets dropping a bit. In November the mode (i.e. the bucket with the most sales) for non-distressed sales was at $350,000 to $400,000, with…

Share:

  • Twitter
  • LinkedIn
  • Facebook
  • Reddit
  • Pinterest
  • Email

December Stats Preview: Foreclosure Surge Edition

Posted on January 3, 2013January 3, 2013 by The Tim

With the last month of 2012 now behind us, let’s have a look at our stats preview. Most of the charts below are based on broad county-wide data that is available through a simple search of King County and Snohomish County public records. If you have additional stats you’d like to see in the preview,…

Share:

  • Twitter
  • LinkedIn
  • Facebook
  • Reddit
  • Pinterest
  • Email

Posts navigation

  • Previous
  • 1
  • …
  • 20
  • 21
  • 22
  • 23
  • 24
  • 25
  • 26
  • …
  • 46
  • Next

Tim’s Other Projects

Dispatches from the Multiverse

Tip Jar

Like what we're doing?

Drop us a tip!

Accounts

  • Log in
  • Entries feed
  • Comments feed
  • WordPress.org
©2024 Seattle Bubble | Built using WordPress and Responsive Blogily theme by Superb