Let’s take one more look at how listings are recovering over the last few months. This first chart shows the difference between the number of new listings each month and the number of pending sales. Prior to late 2011 this number was almost always positive, except in December, when very few new listings hit the…
Tag: stale listings
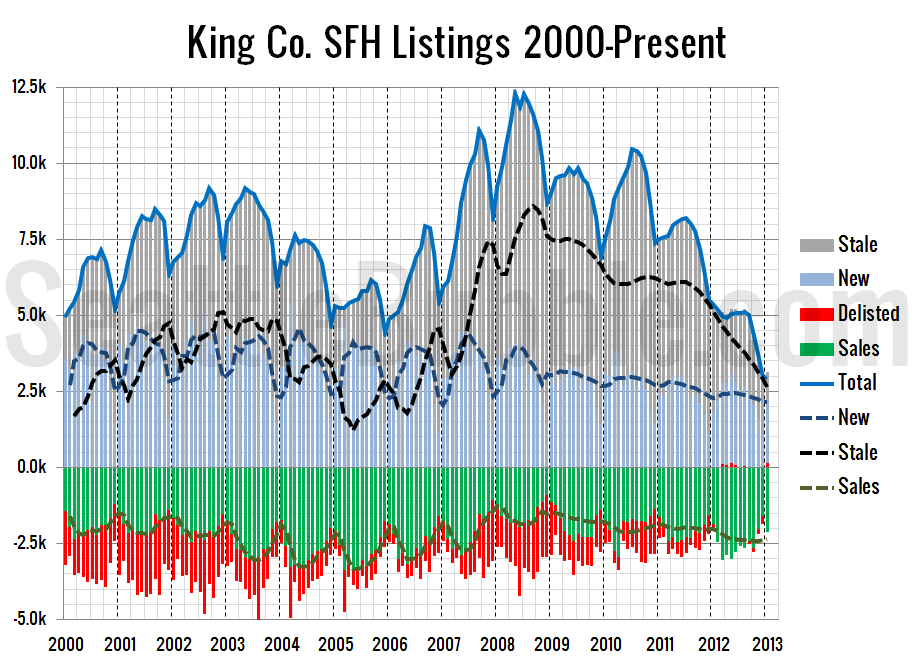
Listings Keep Shrinking; Very Few Homes Delisted in 2012
Here’s a view on listings that we haven’t visited in a while. In this chart I use the NWMLS-published data on new listings, pending sales, and total inventory to visualize the inflow and outflow of single-family listings in King County. First up is a chart that goes back as far as NWMLS data is available:…
Listings: Stale in West Seattle, Fresh in North Seattle
I spent some time this weekend compiling a giant spreadsheet of every active listing in all of King, Snohomish, and Pierce counties, so if you don’t like the interactive Tableau maps, this probably isn’t going to be your favorite week. First up, let’s have a look at a map of the “staleness” of listings. The…
At Least Two Thirds of King County Listings are “Stale”
One of the complaints that I have heard frequently from people looking to buy in today’s market is that despite the near-record number of listings on the market today, much of what is on the market is inventory that has been sitting for months. That sounds like an invitation for a chart. In the chart…
Total Delistings by Year: 2001-2008
On last Friday’s delistings update post, a reader requested that I provide a view of the data showing cumulative year-long numbers. So, here it is: What stands out to me is how relatively stable the number of new listings has been through the past eight years, varying less than 20% from the lowest year (2008)…

