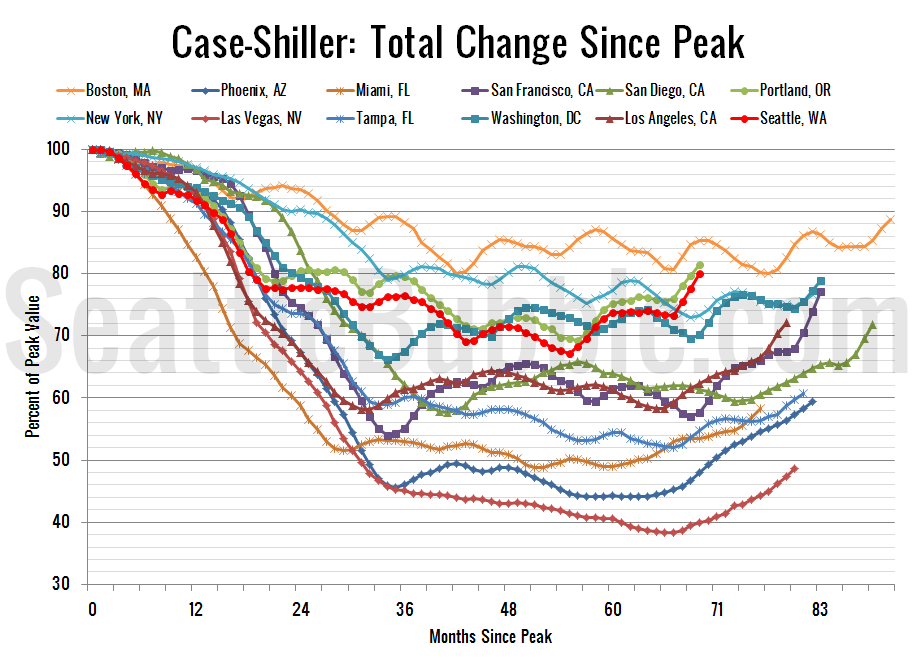
Let’s have a look at the latest data from the Case-Shiller Home Price Index. According to June data, Seattle-area home prices were: Up 1.9% June to July Up 12.5% YOY. Down 17.1% from the July 2007 peak Last year prices rose 1.4% from June to July and year-over-year prices were up 3.1%. After slowing down…
Tag: Tableau
Foreclosures Inched Up in August, But Down From 2012
It’s time for our detailed look at July’s foreclosure stats in King, Snohomish, and Pierce counties. First up, the Notice of Trustee Sale summary: August 2013 King: 582 NTS, down 45% YOY Snohomish: 338 NTS, down 52% YOY Pierce: 467 NTS, down 47% YOY Although the number of trustee sale notices increased month-over-month in all…
Case-Shiller: Home Price Growth Slowed Slightly in June
Let’s have a look at the latest data from the Case-Shiller Home Price Index. According to June data, Seattle-area home prices were: Up 1.8% May to June Up 11.8% YOY. Down 18.6% from the July 2007 peak Last year prices rose 1.8% from May to June and year-over-year prices were up 1.8%. Note that the…
Foreclosures Keep Falling in King, Pierce & Snohomish
It’s time for our detailed look at July’s foreclosure stats in King, Snohomish, and Pierce counties. First up, the Notice of Trustee Sale summary: July 2013 King: 548 NTS, down 44% YOY Snohomish: 282 NTS, down 40% YOY Pierce: 429 NTS, down 16% YOY For the first time since June of last year, all three…
Case-Shiller: Seattle’s Spring Surge Continues
Let’s have a look at the latest data from the Case-Shiller Home Price Index. According to May data, Seattle-area home prices were: Up 3.1% April to May Up 11.9% YOY. Down 20.1% from the July 2007 peak Last year prices rose 2.6% from April to May and year-over-year prices were up 0.6%. Still no surprises,…


