It’s time for our detailed look at June’s foreclosure stats in King, Snohomish, and Pierce counties. First up, the Notice of Trustee Sale summary: June 2013 King: 584 NTS, down 9% YOY Snohomish: 349 NTS, down 10% YOY Pierce: 506 NTS, up 24% YOY Just as predicted, we’ve started to flip to year-over-year declines. This…
Tag: Tableau
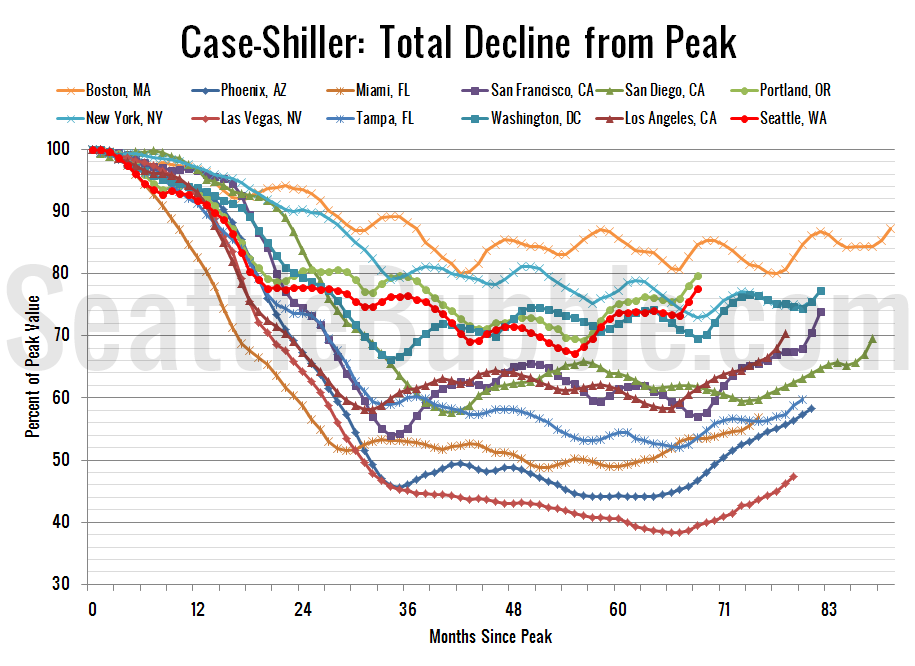
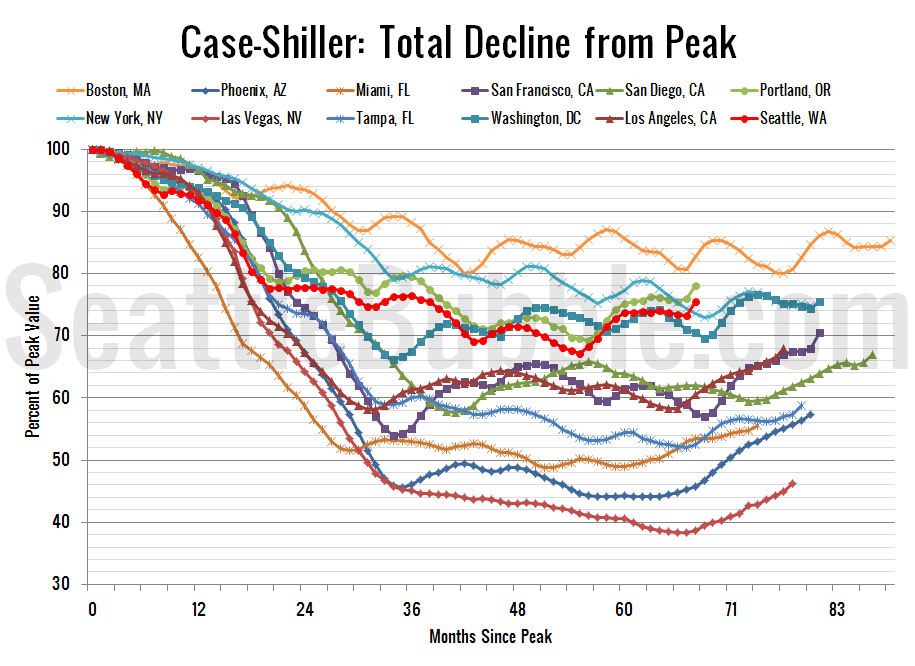
Case-Shiller: Seattle Home Prices Jumped Again in April
Let’s have a look at the latest data from the Case-Shiller Home Price Index. According to March data, Seattle-area home prices were: Up 2.7% March to April Up 11.4% YOY. Down 22.5% from the July 2007 peak Last year prices rose 2.0% from March to April and year-over-year prices were down 1.0%. Nothing surprising about…
Foreclosure Volume Slowly Drifts Back to Earth
It’s time for our detailed look at May’s foreclosure stats in King, Snohomish, and Pierce counties. First up, the Notice of Trustee Sale summary: May 2013 King: 669 NTS, up 10% YOY Snohomish: 426 NTS, up 42% YOY Pierce: 551 NTS, up 15% YOY Nothing much new in these numbers. Still higher than a year…
Case-Shiller: Seattle Home Prices Shot Up in March
Let’s have a look at the latest data from the Case-Shiller Home Price Index. According to March data, Seattle-area home prices were: Up 3.0% February to March Up 10.6% YOY. Down 24.5% from the July 2007 peak Last year prices rose 1.7% from February to March and year-over-year prices were down 1.3%. There’s the big…
Foreclosures Still Shrinking Around Seattle
It’s time for our detailed look at April’s foreclosure stats in King, Snohomish, and Pierce counties. First up, the Notice of Trustee Sale summary: April 2013 King: 746 NTS, up 69% YOY Snohomish: 420 NTS, up 53% YOY Pierce: 598 NTS, up 124% YOY Same story as most of this year: still above last year’s…