Winter for Seattle home prices continued in February according to the latest data from the Case-Shiller Home Price Index.
Down 1.0% January to February.
Down 2.7% YOY.
The only people surprised by this data are the real estate agents that really believed it in 2006-2007 when they told people that it was “a great time to buy.” Home prices in Seattle have now declined a total of 6.5% from their July 2007 peak, and have retreated to roughly where they were in July 2006.
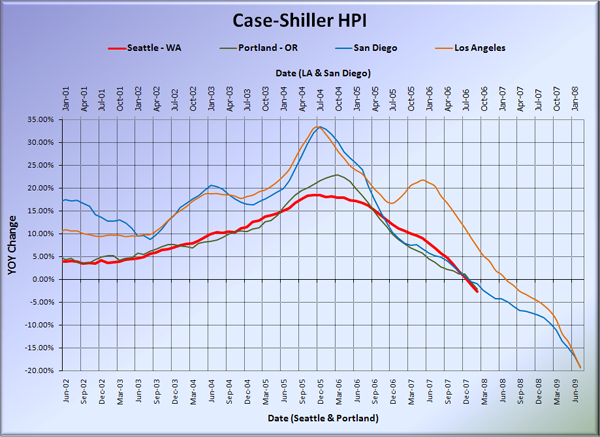
Here’s the usual graph, with L.A. & San Diego offset from Seattle & Portland by 17 months. Seattle’s YOY drop continues to beat Portland, which saw a 2.0% drop in February.
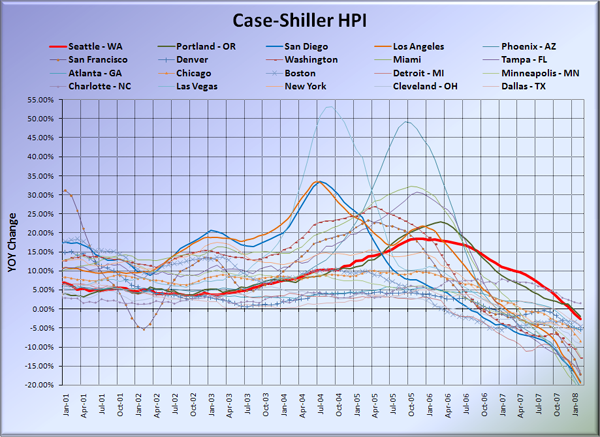
And here’s the graph of all twenty Case-Shiller-tracked cities:
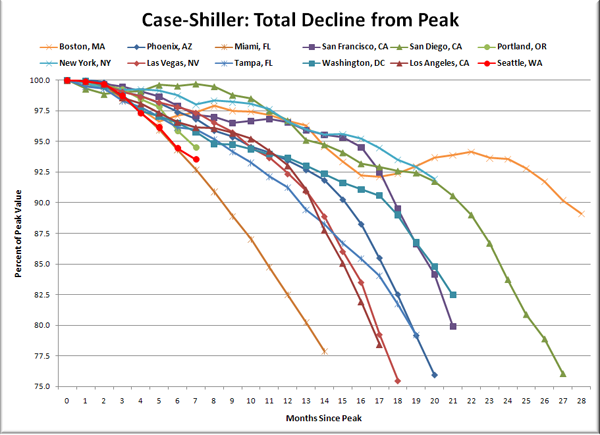
Here’s an update to the peak-decline graph, inspired by a graph created by reader CrystalBall. This chart takes the twelve cities whose peak index was greater than 175, and tracks how far they have fallen so far from their peak. The horizontal axis shows the total number of months since each individual city peaked.
Hey, we improved slightly from Miami’s crash course. Phew!
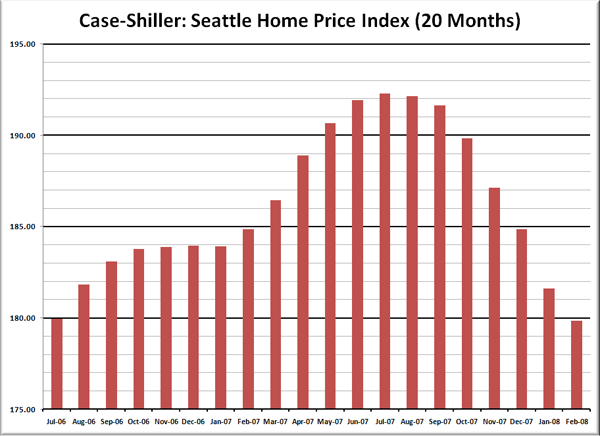
And just to help us visualize the drops better, I’m introducing a new chart this month. In this one, I’ll adjust the horizontal axis to go back just far enough to find the last time that Seattle’s HPI was as low as it is now. This gives us a clean visual of just how far back prices have retreated in terms of months.
So far, we’ve turned the dial back a total of 19 months, to July 2006. Looking at that another way, in the 7 months since Seattle’s peak prices, 12 months of price gains have been wiped out.
Check back tomorrow for a post on the Case-Shiller data for Seattle’s price tiers.
(Home Price Indices, Standard & Poor’s, 04.29.2008)
Update: Here are the links to coverage at the Seattle Times and Seattle P-I.


