Time for September market statistics from the NWMLS.
The NWMLS press release will be posted at this link when it goes up.
Here is your summary along with the usual graphs and other updates.
Here’s your King County SFH summary:
September 2008
Active Listings: up 5% YOY
Pending Sales: up 15% YOY
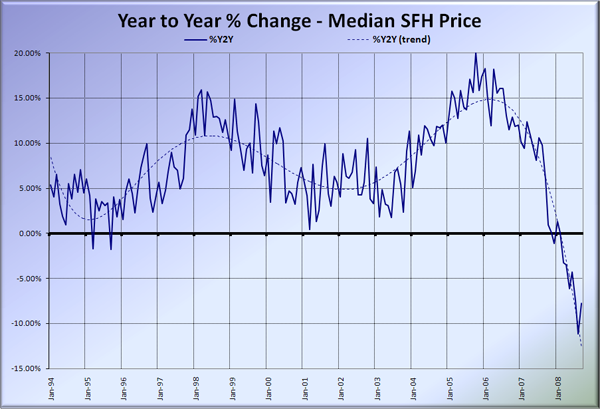
Median Closed Price*: $415,000 – down 7.8% YOY
Here is the updated Seattle Bubble Spreadsheet, and here’s a copy in Excel 2003 format. Click below for the graphs and the rest of the post.
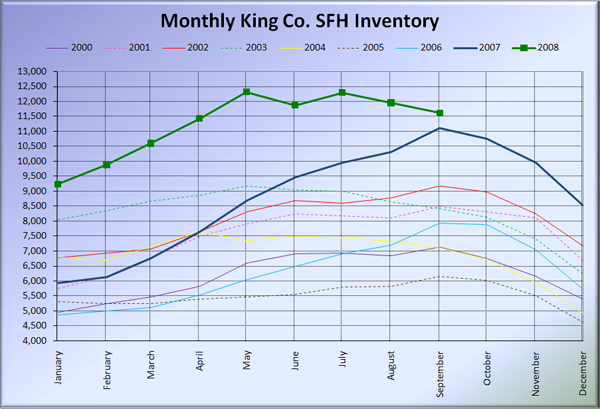
Here’s the graph of inventory with each year overlaid on the same chart.
No big surprise here. Inventory has been pretty level since May, and continued the pattern in September, but still came in slightly above last year’s peak (which was a record high at the time).
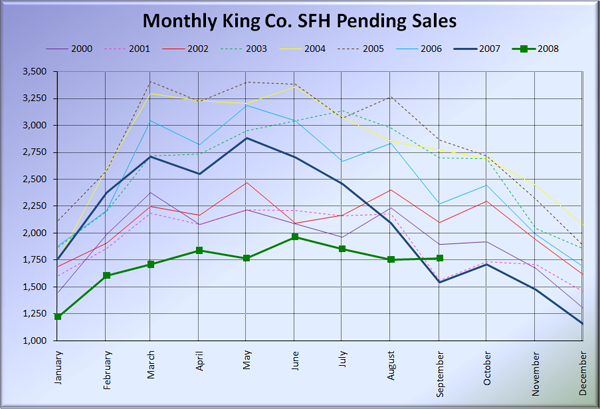
Pending sales are the real shock this month. Every other year on record, sales have dropped off significantly from August to September, but this year they actually slightly increased.
What’s going on here? Have a significant number of buyers decided that the bottom must be in, and now is the time to buy? Are people trying to jump in for some “security” before the economy fully melts down? Is the NWMLS monkeying with the numbers? (I doubt that one, but it is possible.)
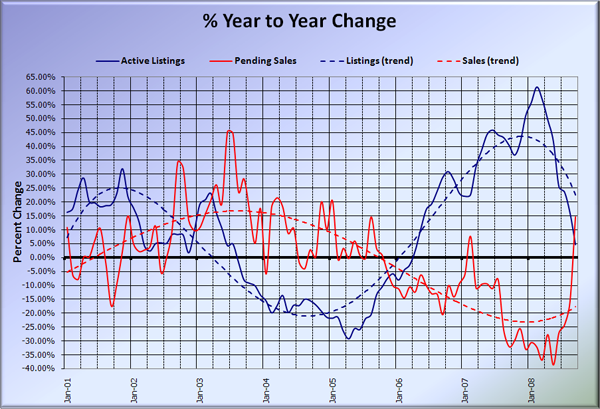
The odd movement in the pending sales statistic threw quite a wrench in the supply / demand graphs. Here’s the supply/demand YOY graph.
In a single month, the pending sales YOY statistic shot from -16% to +15%. Wild. That’s the biggest 1-month change in this particular statistic in the history of the data I have available (back to 2000).
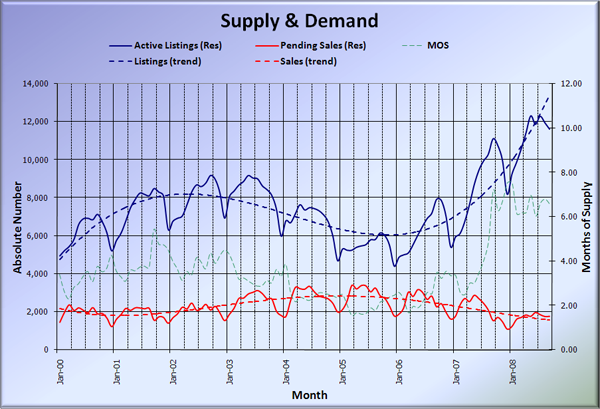
Here’s the chart of supply and demand raw numbers:
The sales bump even looks weird on this one. Where every single other year has seen the decline into the winter sales season begin in September, 2008 sticks out like a sore thumb.
Perhaps we have finally found the floor for King County SFH sales? No matter how bad things get, there will always be 1,700 or so people trying to buy a home? I think it’s still too early to be calling any kind of bottom based on a single month statistic. We’ll see in the coming months whether this was a strange anomoly or the start of a recovery in sales.
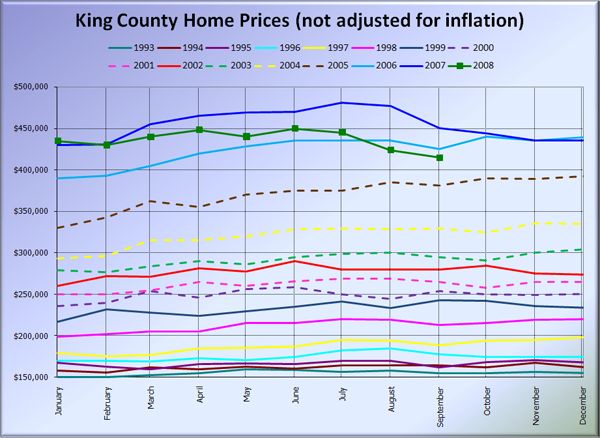
Of course, the slight uptick in sales did not keep the median price from dropping about $9,000 in a month. Even so, the YOY change did bump up slightly from last month, since last year the median fell over $27,000 from August to September.
Here’s the bonus graph from last month, comparing King County SFH prices each month for every year back to 1994.
It looks like it is quite possibly on track to fall below 2005 prices by the end of the year.
Here are the news blurbs from the Times and P-I. Check back tomorrow for the full reporting roundup.
Seattle Times: Median house, condo prices down in September
Seattle P-I: Local housing market stabilizes
