Is it time for November NWMLS market statistics already? Yes, it is.
Here’s the NWMLS press release: November’s Housing Activity in Western Washington Reflects "Microclimates"
“Real estate microclimates can behave very differently,” according to one industry leader in commenting on the latest report from Northwest Multiple Listing Service. On first glimpse, the statistics for much of Western Washington indicate a market slowdown persists, but a closer look illustrates the “microclimate” theory…
Here’s your King County SFH summary:
November 2008
Active Listings: up 2% YOY
Pending Sales: down 21% YOY
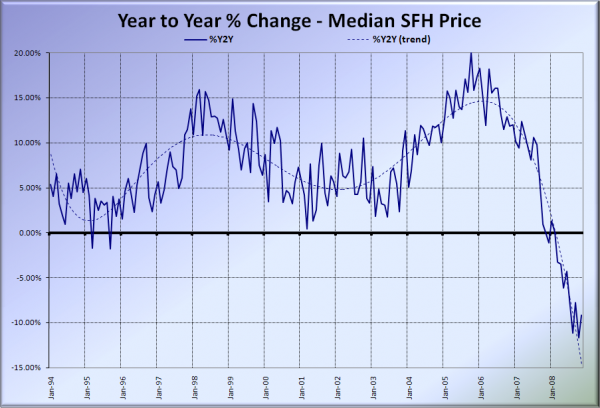
Median Closed Price*: $395,000 – down 9.2% YOY
Like last month, the biggest news isn’t part of the usual set of statistics we summarize here. What immediately jumped out to me was Closed Sales, which were down a whopping 43% YOY, coming in at just 869 SFH sales county-wide.
For comparison, that is lower than any month on record (post-2000). Before the market around here started to deteriorate late last year, the fewest closed sales in any month was 1,235 in February 2001. Last month’s number was 30% lower than that.
For a little more context, from 2000 to 2007 closed SFH sales for November ranged from a low of 1,427 in 2001 to a high of 2,441 in 2004, with an average of 1,947. This November came in at less than half that many closed sales. YIKES.
Here is the updated Seattle Bubble Spreadsheet, and here’s a copy in Excel 2003 format. Click below for the graphs and the rest of the post.
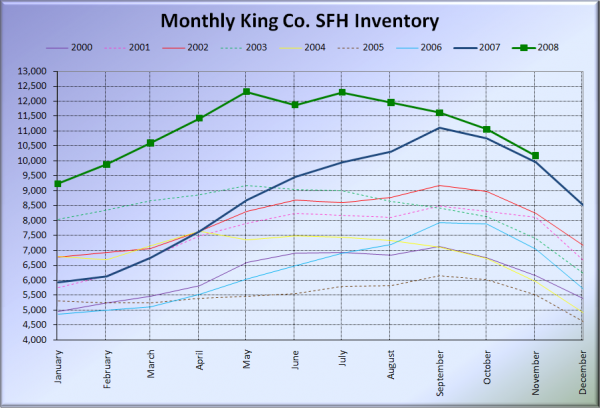
Here’s the graph of inventory with each year overlaid on the same chart.
Inventory is still holding levels just barely above last year’s record highs, declining at an almost identical rate, in the standard manner for this time of year. No surprise there.
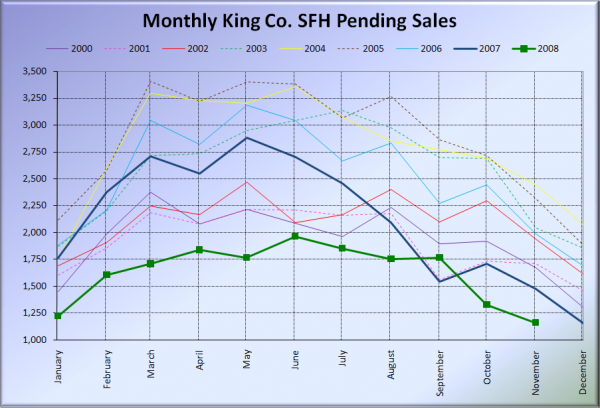
The huge dive (25% in a single month) we saw from September to October translated into an even bigger drop in closed sales, which plummetted over 34% from October to November. Ouch.
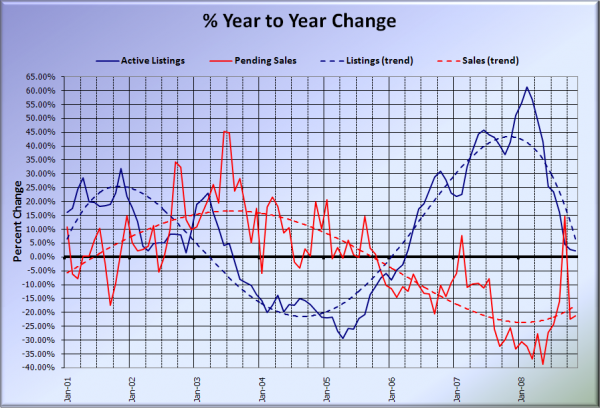
Here’s the supply/demand YOY graph.
Looks like it’s back to the usual negative twentysomethings for the year-over-year sales stats.
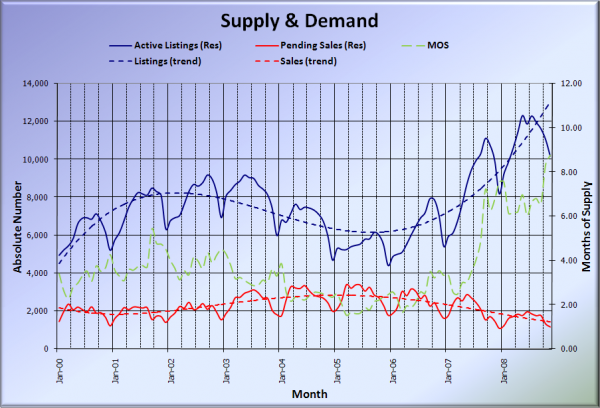
Here’s the chart of supply and demand raw numbers:
Note that Months of Supply shot even higher, reaching yet another all-time-high of 8.75. Maybe next week’s poll question should be something about the maximum MOS we’ll see in King County SFH.
Here’s the median home price YOY change graph:
With a record-low number of closed sales making up the sample set for this statistic, it is not surprising to see the data getting somewhat more noisy.
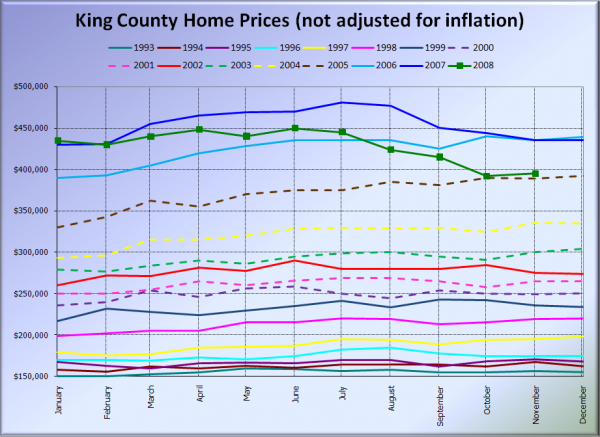
And lastly, here is the chart comparing King County SFH prices each month for every year back to 1994.
November 2008 King County median SFH price: $395,000.
November 2005 King County median SFH price: $389,000.
Here are the news blurbs from the Times and P-I. Check back tomorrow for the full reporting roundup.
Seattle Times: King County home prices fall 9.2% in November
Seattle P-I: November house prices dip from year earlier
I notice that neither of the articles makes any mention of the astounding plummet in closed sales. Shocking.
