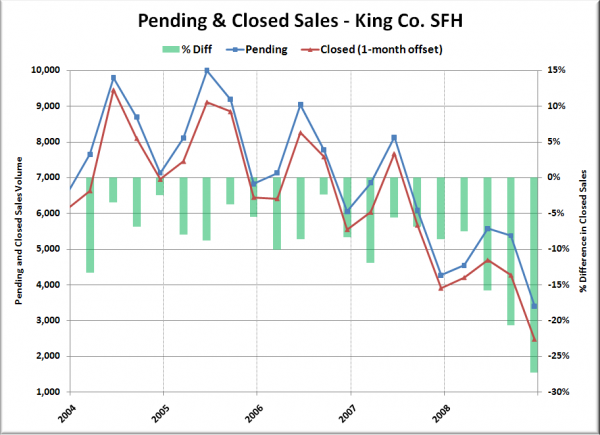
Now that 2008 Q4 + 1 month is in the past, let’s have an updated look at the relationship between pending and closed sales. In Q2, 15.9% of pending sales fell through. In Q3, it was 20.7%.
Below is the updated chart including 2008 Q4. It shows quarterly King County SFH pending sales volume from the NWMLS, with closed sales offset by one month (since most closings theoretically take ~30 days). In other words, the pending sales data for Q4 includes October, November, and December, while the closed data is for November, December, and January. The blue and red lines represent pending and closed sales (left axis), while the green bars represent the percent difference between closed sales and pending sales (right axis).
The 2000-2007 average difference between pending and closed sales for the fourth quarter was just 5.0%. In the fourth quarter 2008, the gap between the two widened to 27.3%.
Yet again, the number continues to grow, and the local media continues to ignore the increasingly alarming discrepancy. Keep this widening gap in mind when agents quoted in the media refer to increasing pending sales as some sort of indication that the market is turning around. Pending sales may be increasing, but more and more of them are never turning into closed sales.
I realize that last quarter there were some who theorized that this discrepancy was the result of the NWMLS rule change in July that caused homes in “Subject to Inspection” status to be pulled from the publicly-viewable listings. However, I have spoken with numerous individuals that have asked various people at the NWMLS (including their “statistician”) directly about this change, and each one has been assured that the new rule did not affect the way that the end-of-month statistics are compiled (i.e. – the definition of “pending” in the monthly reports has remained consistent, despite the rule change).
Are buyers getting cold feet? Is financing falling through? What explanation is there for one in four pending sales to never reach closing?
