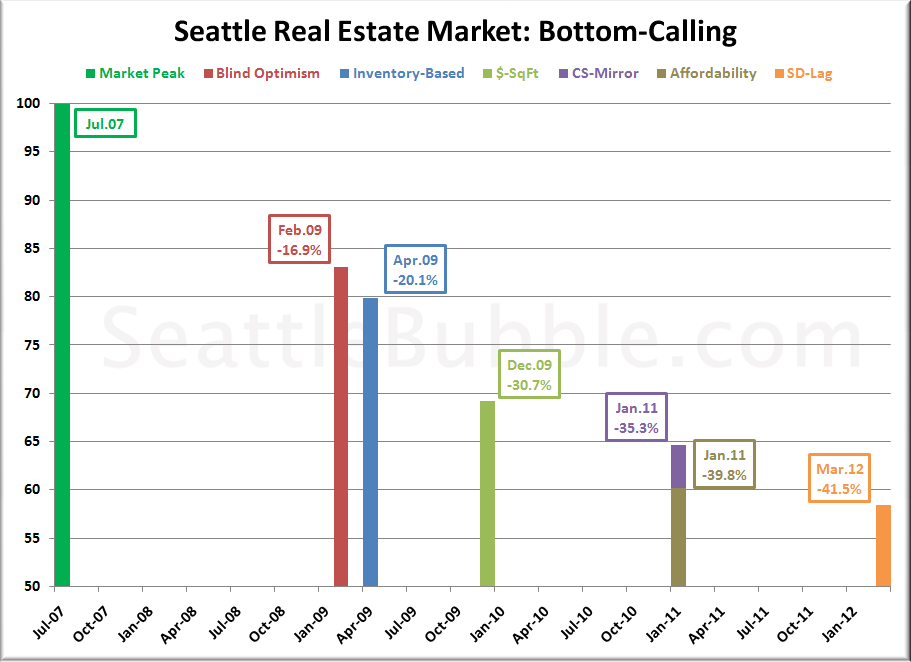
So, after analyzing five (or six) different forecast methods, slicing and dicing the data, and squeezing out as many predictions as we can in a week, we’re left with one simple question: Where is the bottom?
Here’s a summary of the bottom months for each of the forecasts we looked at this week:
Even if we discount the “Blind Optimism” forecast, that’s still a range of almost three years and over 20 percentage points between the most optimistic forecast and the most pessimistic one. As each of these bottom dates and percent declines come and go, we’ll post updates here so you can adjust your own bottom-catching strategies.
Of course, one thing that none of these forecasts really takes into consideration is the possibility of a deep and prolonged recession or depression. The underlying assumption behind any real estate market bottom in the next few years is that the overall economy at least flattens out. If things continue to deteriorate, or if we really are going through “The Great Reset,” all bets are off when it comes to any of these forecasts.
Along these same lines, it is important to realize that coming up with a perfect mathematical forecast model for a market like this is impossible. There are simply too many variables. With these forecasts, we have done the best we can to come up with some reasonable models, but every model has its own flaws.
On the whole, I have attempted to be relatively fair in these forecasts. However, one could certainly make the point that a number of my assumptions have been too optimistic. For one such view, feel free to refer to John Talbott, the author that published the prescient book The Coming Crash in the Housing Market in 2003 (3 years before the national peak), followed by Sell Now!: The End of the Housing Bubble in January 2006 (just months before the nationwide market began to deteriorate). In his latest book, Contagion, he forecasts that home prices will retreat to 1997 levels, adjusted for inflation. Looking at the long-term inflation-adjusted chart of Seattle home prices, I can see how such a prediction might be within the realm of possibility.
However, limiting my selection to the range of information presented in the five forecasts featured on these pages this week, I put the most weight on the Dollars per Square Foot, Case-Shiller Mirror, and Affordability forecasts. If we take the average of those three, we’d be looking at a bottom sometime in mid to late 2010, at around 35% total depreciation from the peak. This would put us back to roughly early 2004 pricing, which seems about right to me based on the long-term fundamentals.
So my personal bottom call for the Seattle real estate market, given the information available in February 2009, is December 2010 at 36% off the peak. As with my likelihood ratings on the individual forecasts, this is a totally subjective determination, assigned according to my gut feeling after working with the data. Treat it accordingly.
Bottom-Calling Week on Seattle Bubble
- Introduction: Bottom-Calling Week on Seattle Bubble
- Method 0: Blind Optimism
- Method 1: Inventory-Based Forecast
- Method 2: Dollars per Square Foot Linear Forecast
- Method 3: Simple Mirror Forecast
- Method 4: Affordability Index Forecast
- Method 5: San Diego Lag Forecast
- Conclusion: So Where’s the Bottom?
