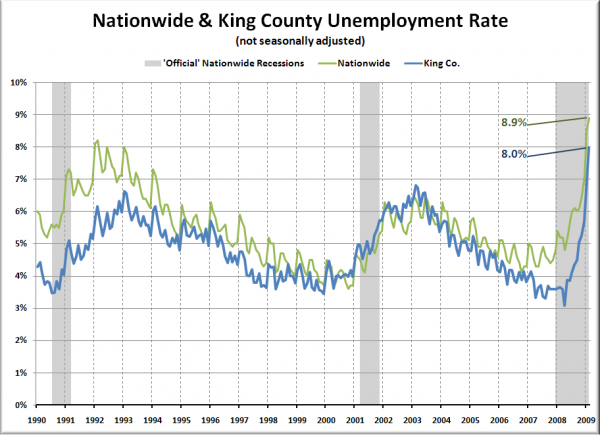
Washington State’s latest unemployment statistics came out yesterday, and King County came in with a staggering 8.0% unemployment rate.
To put this in context, I created the following graph, which charts local unemployment back to 1990 (as far as I can locate data), and compares it to the nationwide unemployment rate as well as “official” recessions as measured by the National Bureau of Economic Research.
Note that these measures are from the U3 series, which is based on a relatively narrow definition of unemployed persons. The nationwide U6 unemployment rate came in at 16.0% for February. Unfortunately the broad U6 measure does not appear to be available for King County. Hit Wikipedia for more information on the different measures of unemployment.
King County’s rapid increase in unemployment tracks pretty closely to the growth in the nationwide rate, virtually erasing the gap that had grown between the two through 2006 and 2007. With a 1.3-point increase over January, King County’s unemployment rate rose over three times faster than the nationwide rate month-to-month in February. If this rate of growth were to continue, King County unemployment will fully catch up to the nationwide rate this month.
It is also worth noting that the latest unemployment rate for King County absolutely blasted past the peaks that were reached following each of the previous two recessions (6.6% and 6.8%). If past performance is any indication of where we are headed this time, we could easily end up seeing 15% unemployment here in King County before things start to improve.
I hope I’m wrong, but unfortunately there is nothing in the statistics to currently point toward a more optimistic outlook.
Sources:
Recessions: National Bureau of Economic Research
National Unemployment: Bureau of Labor Statistics
Local Unemployment: Washington State Employment Security Department
