I received a reader request via email a few days ago for an update on the Radar Logic dollars per square foot home price bottom chart from our February 2009 bottom-calling series.
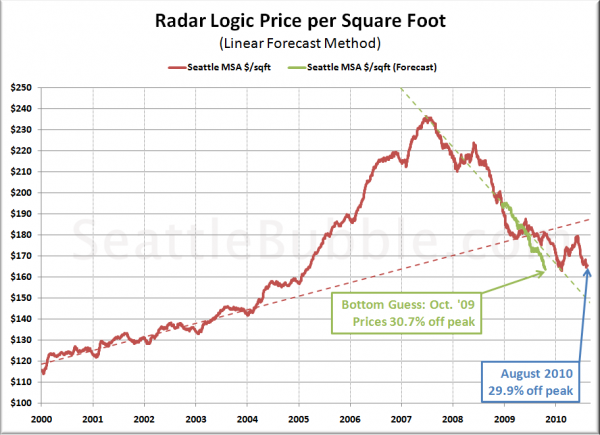
In our last checkup back in March, prices were still falling, and had almost reached the “bottom” from the February 2009 forecast of 30.7% off the peak.
Here’s an update to our dollars per square foot bottom call chart:
Looks like our March update actually hit a temporary false bottom almost right on the nose. Between our last update and the most recent data (August 11th), prices bounced up slightly to as high as 24% off the peak in early June, but have since re-retreated back down to 30% off the peak.
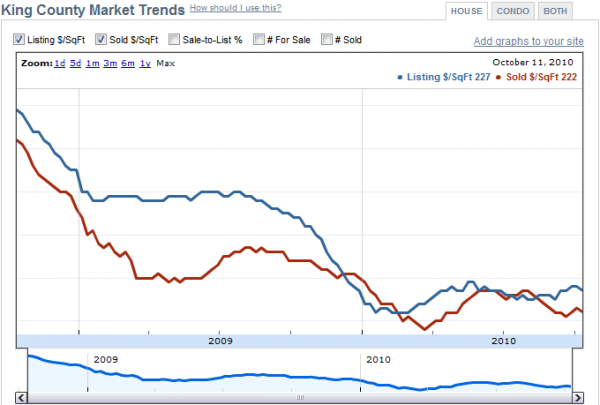
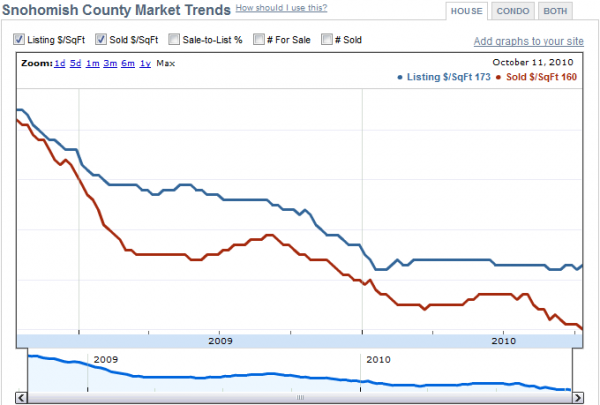
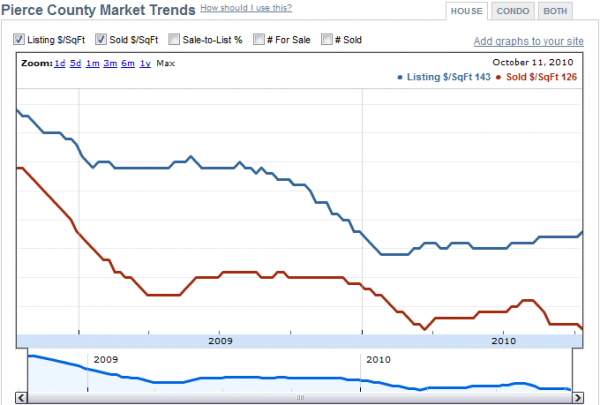
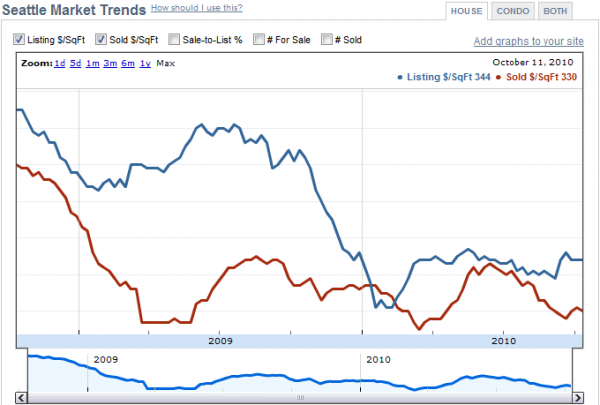
For comparison, here are similar charts for King, Snohomish, Pierce, and Seattle proper from Redfin:
Spring: $218/sqft. Summer: $227/sqft. Latest: $222/sqft.
Spring: $164/sqft. Summer: $167/sqft. Latest: $160/sqft.
Spring: $126/sqft. Summer: $131/sqft. Latest: $126/sqft.
March low: $325/sqft. June mini-peak: $343/sqft. Latest: $330/sqft.
Seattle and King County are definitely holding up better than outlying Snohomish and Pierce, which are both at or below their lowest points to date. However, even in Seattle proper, 2010’s summer peak was lower than 2009’s summer peak, despite the supposedly better economy and the tax credit.
Given the trend of this dollars per square foot data and the findings of our recent big picture analysis, I’m comfortable saying that we’re still not quite at the bottom when it comes to the price per square foot of Seattle-area homes.
