In the comments on yesterday’s post, Jonness took me to task for my claim that the incomes of likely homebuyers saw a notable boost between 1996 and 2001.
Ask yourself why house prices have fallen less percentage-wise in Thurston County than King County? Google doesn’t have a campus in Olympia, and very few people down there make $100K salaries. I strongly urge you to analyze more of the PacNW than just Seattle. Otherwise, I fear you will never see this for what it really is. House prices are extremely bubbled compared to incomes throughout the entire PacNW. I’m actually quite shocked you don’t realize this.
First off, I do analyze more of the region than just Seattle. I haven’t updated the Around the Sound post series lately, but I dig deep into data from all across the Sound for Sound Housing Quarterly. I tend not to post as much of that data here, since the name of the site is Seattle Bubble, not Washington State Bubble.
However, since you asked, let’s have a look at some price to income data from the broader region. First up, let’s look at the six-county Puget Sound region. In the chart below I’ve plotted the ratio of median single-family home price to median household income over time.

The chart above demonstrates the point I’ve been making quite well. Notice how between 1996 and 2001, only King County had consistent growth in this ratio. Every other Puget Sound county was basically flat until the housing boom started to heat up.
Here’s how much each county’s ratio changed between Q2 1994 and Q1 2003:

Three times as much growth in King County than anywhere else. That is the “wealth effect” I’m talking about. Median household incomes didn’t grow inordinately more in King County during that time, but home prices did. Something had to drive them up, and that something seems to be fairly localized to Seattle.
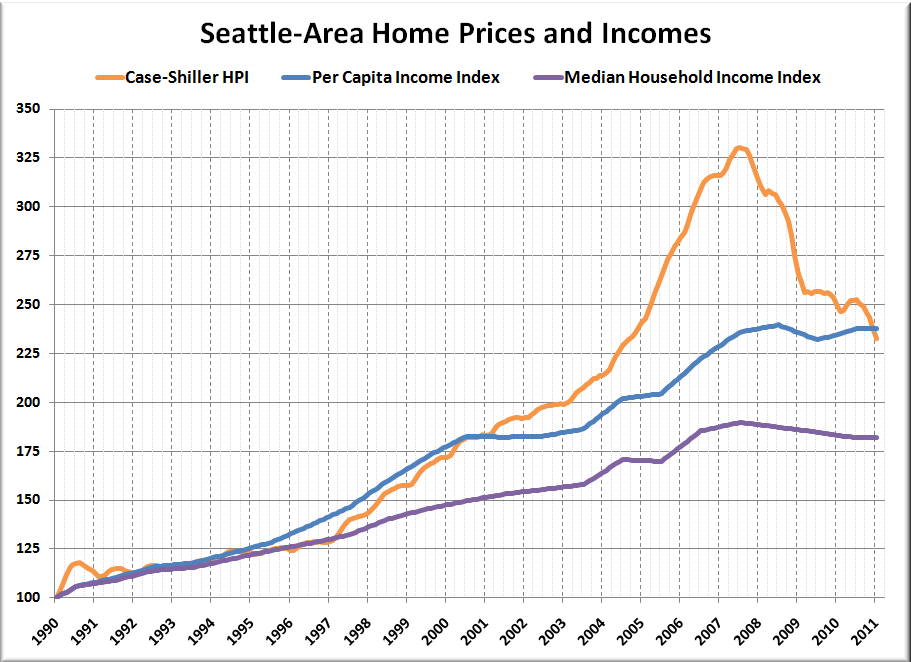
This is why I think the mix of incomes in King County changed enough during the pre-bubble years to make it worthwhile to explore other measures such as per capita income.
What about outside of the Puget Sound? Let’s have a look at a sampling of counties around the state:

Same story here. In the northeast, southwest, southeast, and far west corners of the state, the home price to income ratios basically flatlined between 1994 and 2003, but in King County, it shot up over 30%, despite the similar income trends in all these areas. Should we just ignore that? Pretend it didn’t happen?
The point I’m making here is that the upper incomes around Seattle got wealthier faster just before the housing bubble during the tech boom, as evidenced by the growth in per capita incomes, thus making 2003 a better baseline for local housing market economic fundamentals than any time in the ’90s or before.
This wealth distribution shift would only barely be reflected in the median household income, but it most certainly affected home prices. How could it not have? If the rich got richer (as I claim they did in Seattle during that time), that’s an important factor to consider since the rich are the ones that buy homes (to live in and as investments), not the poor.