Nearly three years ago, Deejayoh posted a great comparison chart showing how the US housing bubble compared to the housing bubble Japan experienced in the late ’80s and ’90s. Let’s have an updated look at those charts.
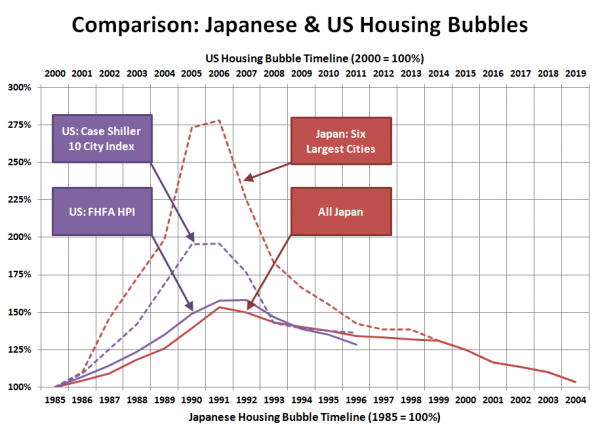
First up, here’s the chart of the straight-up U.S. and Japan home prices, updated through the latest 2011 data:
In Japan, nearly twenty years after home prices began their rapid ascent, they were right back where they started. Twelve years into our bubble, we’re running just a little bit ahead of Japan.
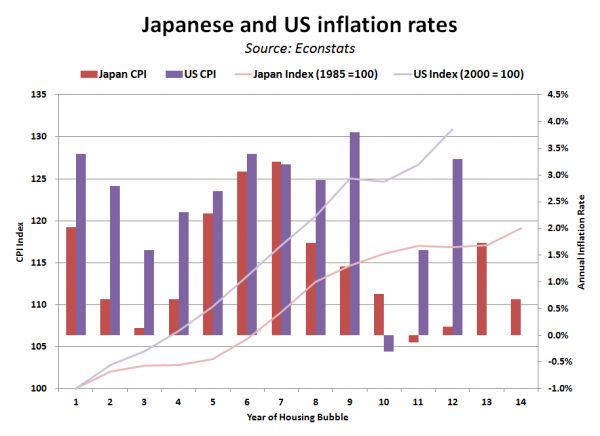
Next up, here’s the chart of inflation rates in the two nations:
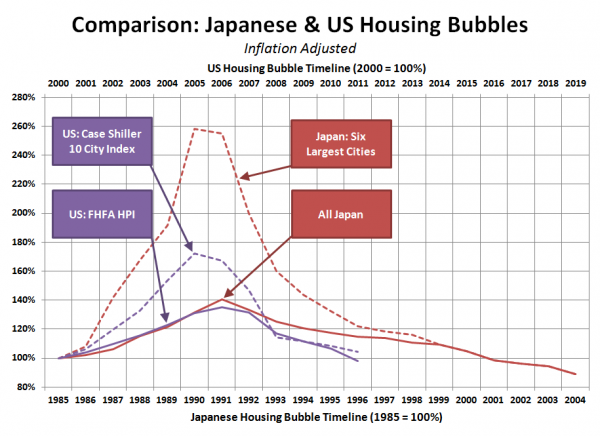
As the bubble has been deflating, monetary inflation in the U.S. has been a lot higher than it was in Japan during the comparable period of their bubble. As a result, home prices in the U.S. have actually fallen a bit faster than their Japanese counterparts when adjusted for inflation:
By that measure we’re four to five years ahead of Japan’s price rewind, and the nationwide index has actually dropped to below where it was in 2000.
Here’s hoping that after repeating such a stark lesson in two decades in two nations, people have finally realized that real estate is not some kind of magical foolproof investment.


