Full disclosure: The Tim is employed by Redfin.
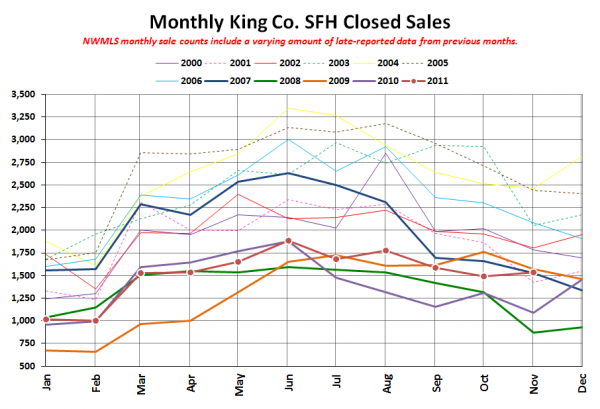
I noticed something a little fishy in last month’s sales numbers from the NWMLS. See if you can spot it in the closed sales chart:
Notice how the number of closed sales ticked up between October and November this year, when every other year there was a decrease between those two months? Hmm.
Since we discovered in the past that the NWMLS has lousy sales accounting practices, I wanted to get a comparison with Redfin’s sales data, which is both more complete (includes MLS sales and off-MLS sales from public records) and more accurate (counts sales in the month they actually closed).
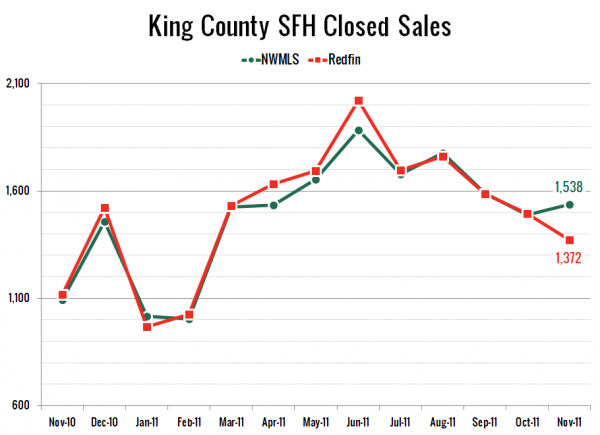
Here’s a chart of the last year’s worth of NWMLS stats and the last year’s worth of Redfin stats (xls) for King County closed single family homes:
According to the NWMLS, closed sales increased 3.3% from October to November, but according to Redfin, closed sales decreased 8.2%. That’s quite the difference. Most months, the difference between the sales numbers reported by NWMLS and Redfin differ by less than two percent. In November that difference shot up to 11%.
If you look at the chart, you can see that it looks like the NWMLS may have slightly under-reported sales in April, May, and June. I suspect that a bunch of agents may have gone into their system and finally reported sales that actually closed during those months, pushing up the reported November sales.
Whatever the case, I think it’s safe to say that despite what the NWMLS claims, sales did not in fact break their regular seasonal routine of falling between October and November.

