Okay let’s revisit the discussion on local incomes once more.
First up, I’d like to highlight the top comment from Monday’s discussion, posted by “gr8day”:
I make less today than I did 6 years ago. So does my barber, my brother, my next door neighbor, best friend, pastor at church, and most of the people I work with. (Perhaps the employees of Amazon make more – but I am not good friends with anyone who works there). This is not taking into consideration inflation or other fuzzy math, but real end-of-week paycheck amounts. I also have less benefits – no more 401K match or education benefits, and I pay higher medical insurance.
I know of 10 families that are now living multi – generational. The kids have moved in with parents or vice – versa. Most have families w/children and are are living w/ in-laws. They are not internationals where this is common practice – they are from the US, where this practice has not been seen in the recent past.
The issue is jobs. Until people have reliable jobs, it is a risk to purchase a home and commit to a monthly payment in a specific location for 30 years. What if I need to move for a new job? There is too much instability in the financial world and the job market for most of my circle to take that leap. How does one pay for a house payment and then also property taxes, upkeep, car payment/repairs, school loans, save for kids education, dentist, school fees, raising utility costs, retirement savings (I will need about a million – ha ha ha)… and on and on… when I have unstable employment?
Years ago I took a financial planning class. At the end of it I realized how important my monthly income was. It is my ability to earn an income that will keep me with food and shelter. No income…no money for food and shelter.
That is my compelling coherent case… after years of fancy research.
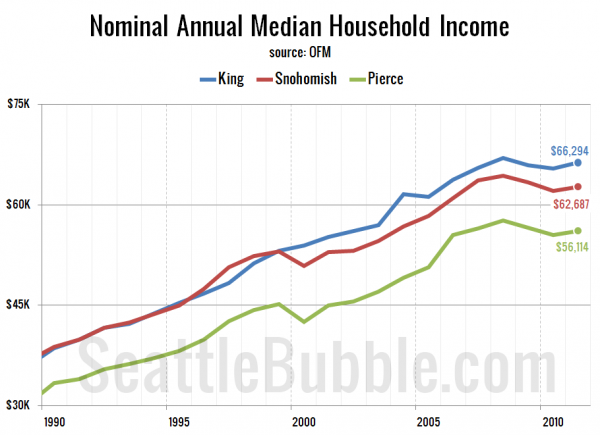
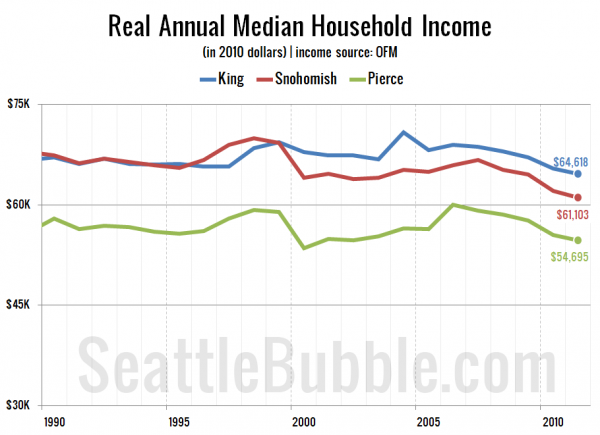
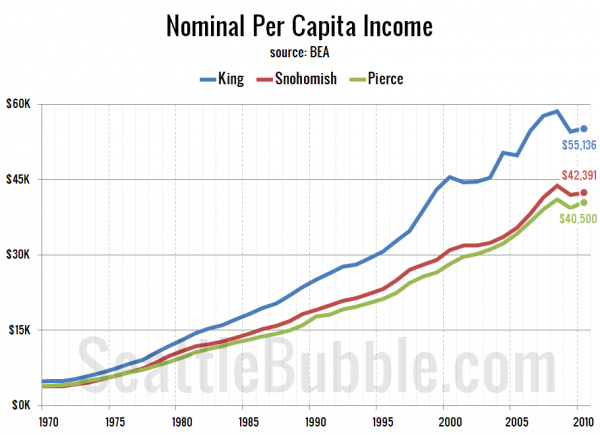
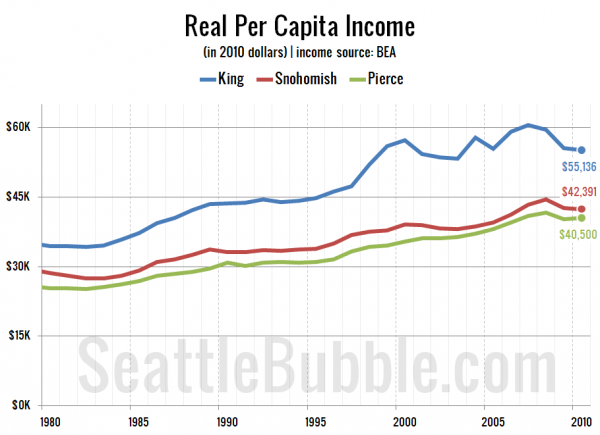
There were also numerous comments about real (inflation-adjusted) vs. nominal incomes, as well as one suggestion that I post per capita income. While my point was simply that nominal incomes have risen and will likely continue to rise, I went ahead and downloaded the per capita income data from the Bureau of Economic Analysis as well as the Consumer Price Index data from the Bureal of Labor Statistics, in order to produce a full set of the following four charts.
First up the same chart I posted on Monday, nominal median household incomes:
Next, median household incomes adjusted for inflation using the Seattle-area CPI less shelter, expressed in 2010 dollars:
No increases there since 2007. Incomes are rising, but not quite at pace with inflation.
Next, nominal per capita income. Note that while the latest median household income from the OFM is from 2011, the most recent per capita income data from the BEA is from 2010:
Steady, four-decade upward trend there save for the post dot-com bubble and post real estate bubble.
Finally, here is per capita income in 2010 dollars:
It’s interesting to me that this one shows more of an upward trend over the long term than real median household incomes. Also, the real decline between 2009 and 2010 is much less severe in per capita incomes that it is in median incomes, with Pierce actually showing an increase.
So what does it all mean? My take is that incomes are not robust, and we aren’t seeing any strong gains post-boom yet, but they also aren’t falling through the floor, and things are the trend is moving in a better direction than it was between 2007 and 2009. I still expect things to improve over the next few years.


