June market stats were published by the NWMLS today. Before we get into our monthly stats, here’s a quick look at their press release.
Home sales sizzling around Western Washington, with volumes reaching 10-year high
Temperatures around Western Washington were not the only thing sizzling during June. Northwest Multiple Listing Service members reported 11,453 pending sales last month, the highest volume since August 2005 when members notched 11,546 mutually accepted offers. Last month also marked the fourth consecutive month of 11,000-plus pending transactions.
MLS members credit first-time buyers, an influx of relocating workers, and escalating rents for part of the surge.
“First time buyers are returning to the market, but cautiously and with more knowledge based on market values and trends,” said George Moorhead, designated broker and owner at Bentley Properties in Bothell.
“Educated buyers today are no longer just dipping their toes in the water. They are diving right in,” reported Mike Gain, CEO and president of Berkshire Hathaway HomeServices Northwest Real Estate. Gain, a past chairman of the Northwest MLS board, said in his 38 years in the industry he’s experienced “good years, bad years and everything in between,” but he’s never seen a market as complex as the current one. “It’s been challenging for everyone involved in a real estate transaction, whether buyer, seller or agent.”
Gain and many of his colleagues bemoan the lack of listings. “The only real problem we are experiencing today is the lack of inventory,” he said.
Home salespeople are no longer attempting to hide how giddy they are that prices are surging once again. They’re in all-out party mode. We’ll see how long the party lasts this time.
NWMLS monthly reports include an undisclosed and varying number of
sales from previous months in their pending and closed sales statistics.
Here’s your King County SFH summary, with the arrows to show whether the year-over-year direction of each indicator is favorable or unfavorable news for buyers and sellers (green = favorable, red = unfavorable):
| June 2015 | Number | MOM | YOY | Buyers | Sellers |
|---|---|---|---|---|---|
| Active Listings | 3,418 | +4.2% | -23.2% |  |
 |
| Closed Sales | 2,904 | +8.2% | +17.3% |  |
 |
| SAAS (?) | 1.18 | -2.6% | -16.8% |  |
 |
| Pending Sales | 3,321 | -3.7% | +4.6% |  |
 |
| Months of Supply | 1.18 | -3.7% | -34.5% |  |
 |
| Median Price* | $500,000 | +4.0% | +10.3% |  |
 |
Feel free to download the updated Seattle Bubble Spreadsheet (Excel 2003 format), but keep in mind the caution above.
Summary: Everything still sucks for home buyers. Big time.
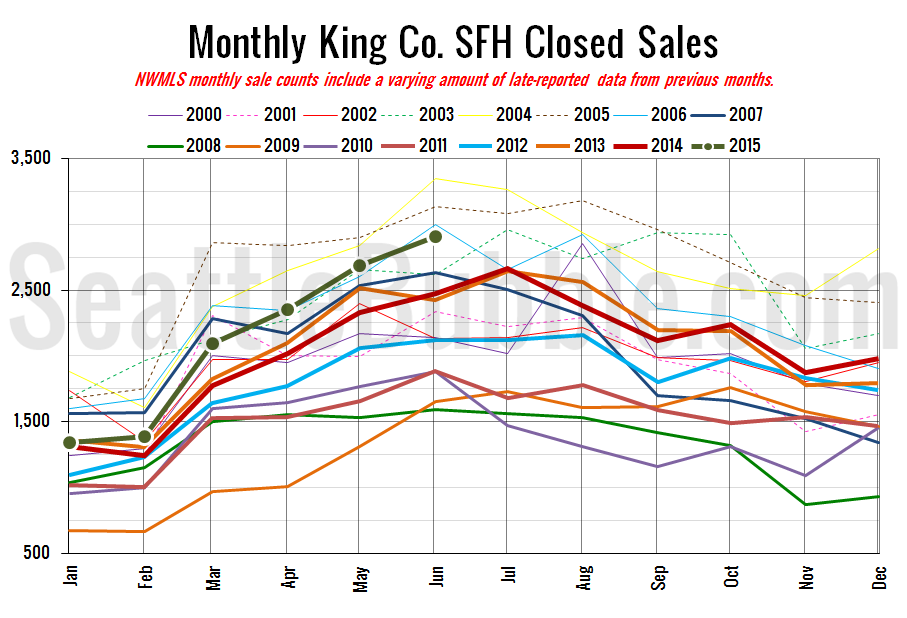
Here’s your closed sales yearly comparison chart:
Closed sales rose 8 percent from May to June. Last year they rose 6 percent over the same period. Closed sales volume in May was at its highest level since August 2006. Only six months since January 1993 have ever seen 3,000 or more closed sales of single-family homes in King County.
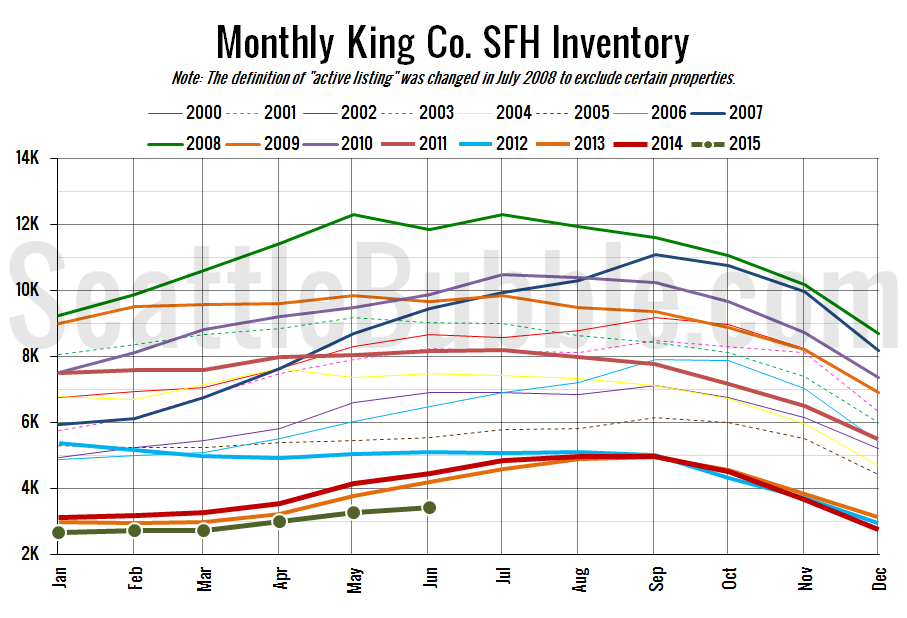
Here’s the graph of inventory with each year overlaid on the same chart.
Inventory inched up again slightly May to June, but yet again turned in the lowest ever recorded level for the time of year. Year-over-year inventory is still down double digits, with the largest decrease since May 2013.
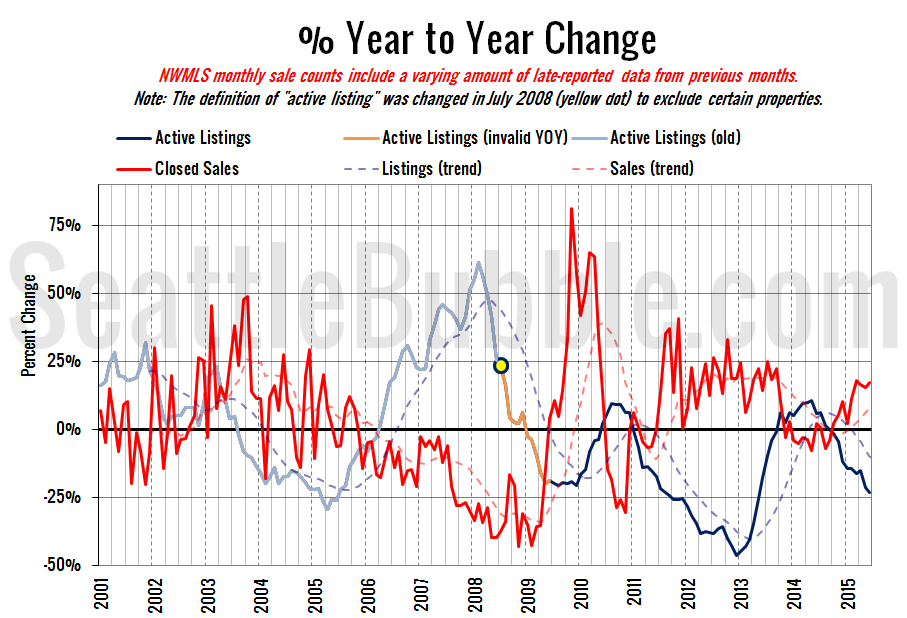
Here’s the supply/demand YOY graph. “Demand” in this chart is represented by closed sales, which have had a consistent definition throughout the decade (unlike pending sales from NWMLS).
Everything in this chart is moving in sellers’ favor.
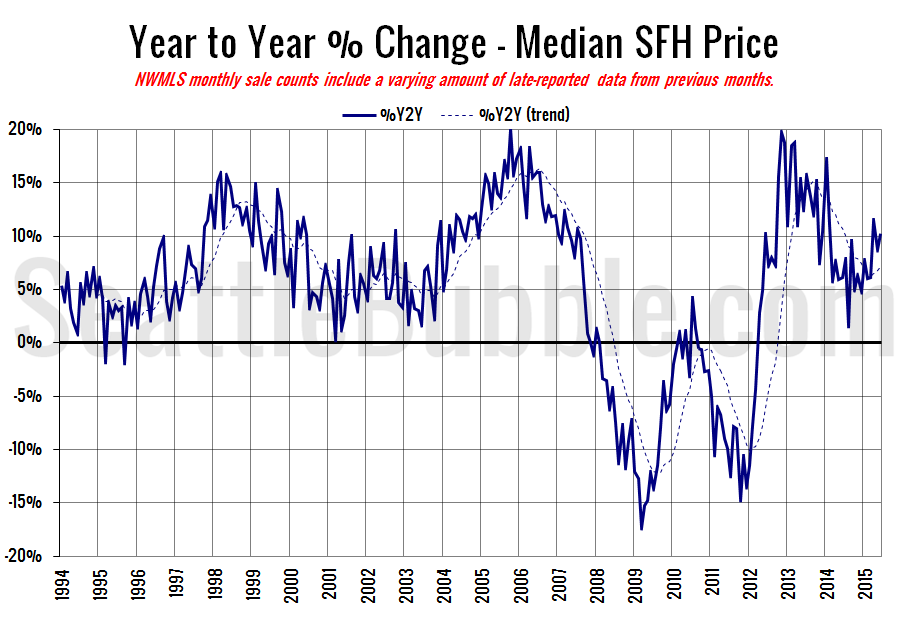
Here’s the median home price YOY change graph:
Back into double-digit territory.
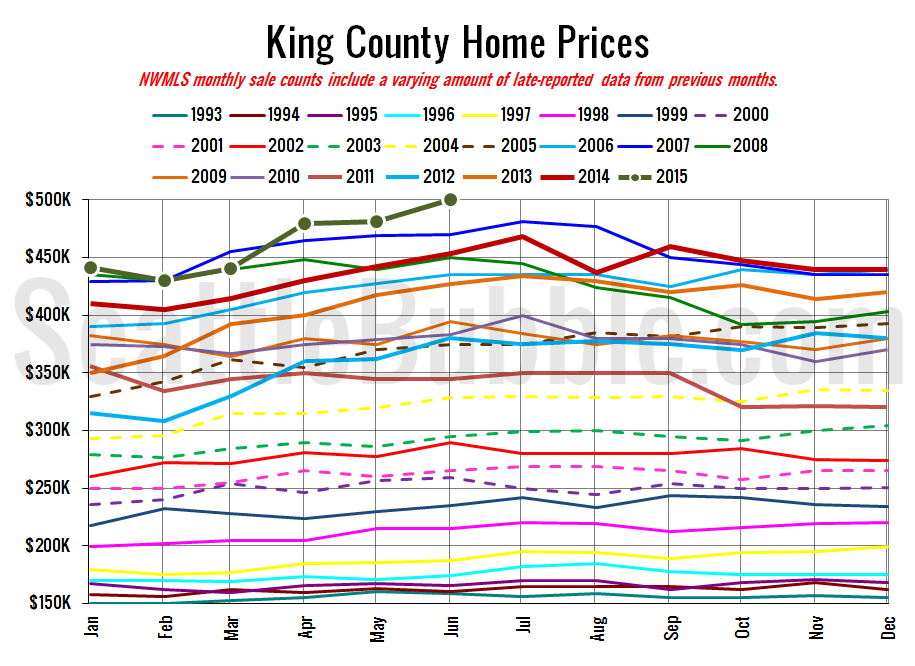
And lastly, here is the chart comparing King County SFH prices each month for every year back to 1994 (not adjusted for inflation).
The median home price shot up in June to a new all-time high (not adjusted for inflation).
June 2015: $500,000
July 2007: $481,000 (previous high)
Here’s this month’s article from the Seattle Times: Median price for single-family homes pushes past $500,000 in King County
Check back tomorrow for the full reporting roundup.
