Get access to the full spreadsheets used to make the charts in this and other posts, as well as a variety of additional insider benefits by becoming a member of Seattle Bubble.
February market stats were published by the NWMLS yesterday. Before we get into our monthly stats, here’s a quick look at their press release.
Home buyer frustration builds as inventory shrinks, prices rise
Home prices in King County hit new highs in February as buyers tried to outbid each other for the sparse inventory in much of Western Washington.“We’re in for another crazy spring real estate market,” predicts J. Lennox Scott, chairman and CEO of John L. Scott, Inc.
Whoa, calm down there, Lennox. Try not to get too excited. Wipe a little bit of that froth away from your mouth.
Scott described current activity as a “Pac-Man” market – “Houses are being gobbled up as soon as they come on the market,” he stated.
Today I learned: J. Lennox Scott has apparently never actually played Pac-Man.
NWMLS monthly reports include an undisclosed and varying number of
sales from previous months in their pending and closed sales statistics.
Here’s your King County SFH summary, with the arrows to show whether the year-over-year direction of each indicator is favorable or unfavorable news for buyers and sellers (green = favorable, red = unfavorable):
| February 2016 | Number | MOM | YOY | Buyers | Sellers |
|---|---|---|---|---|---|
| Active Listings | 1,923 | -0.6% | -29.3% |  |
 |
| Closed Sales | 1,330 | +1.2% | -3.8% |  |
 |
| SAAS (?) | 1.29 | +26.5% | -4.8% |  |
 |
| Pending Sales | 2,299 | +26.9% | -7.5% |  |
 |
| Months of Supply | 1.45 | -1.8% | -26.5% |  |
 |
| Median Price* | $514,975 | +4.9% | +19.8% |  |
 |
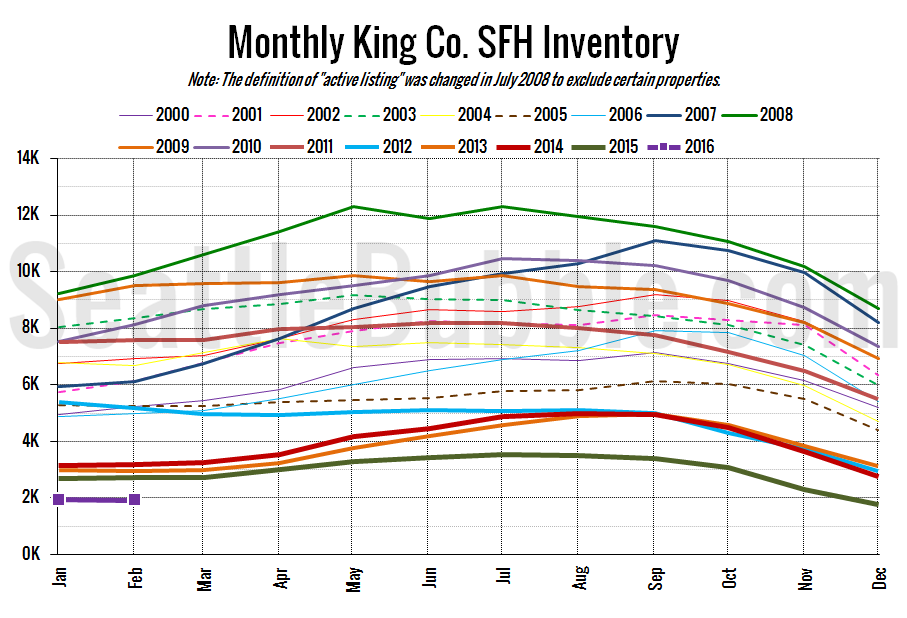
Last month we saw a slight uptick in inventory, but this month the number of homes on the market fell back down a bit again, putting us at the lowest February inventory level on record. With just 2,101 new listings hitting the market last month, February 2016 also saw the fewest new listings on record for a February, just barely beating out the previous low set in 2014.
Basically, if you’re buying a home in the Seattle area right now, expect to have very little selection and lots of strong competition. Not a fun time to be a home buyer.
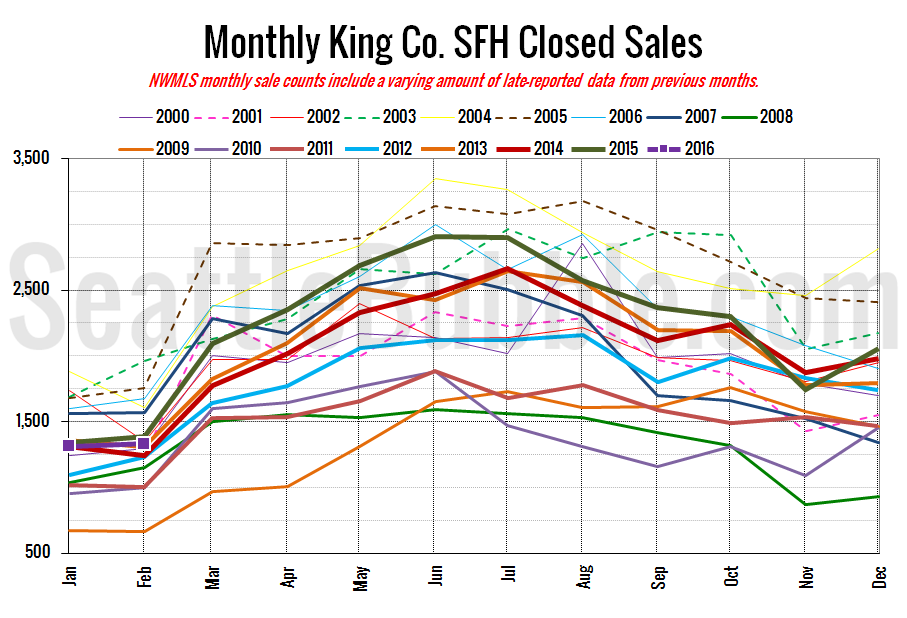
Here’s your closed sales yearly comparison chart:
Closed sales were up just slightly from January to February, and down slightly from a year ago. Small comfort to buyers, given the scarcity of listings.
It looks like the softening in the sales stats we saw in January was apparently just a blip, rather than the start of a trend.
Here’s the graph of inventory with each year overlaid on the same chart.
Total inventory is at its lowest February level on record. New listings increased slightly from January, but there were fewer new listings than pending sales, so don’t expect to see inventory increase any time soon.
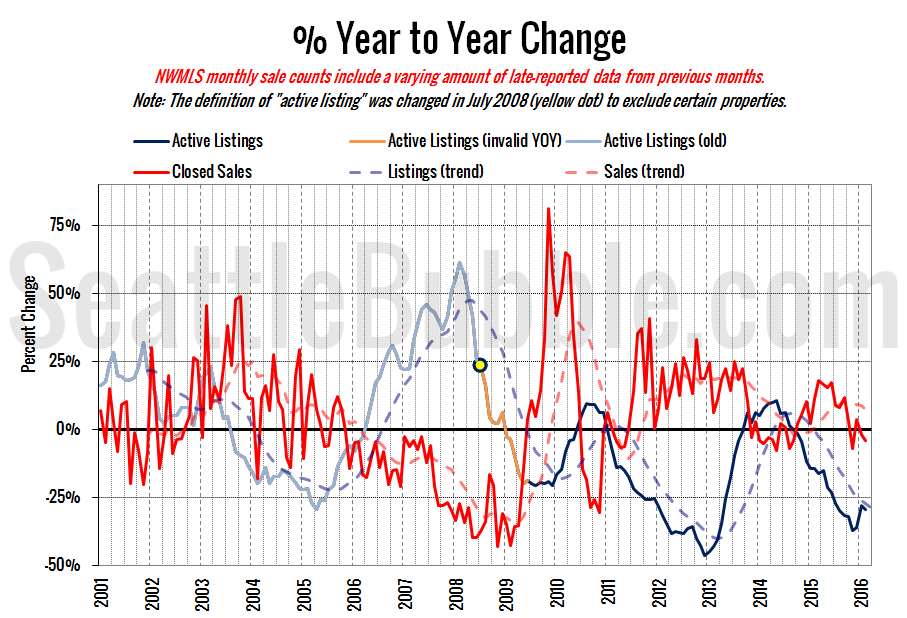
Here’s the supply/demand YOY graph. “Demand” in this chart is represented by closed sales, which have had a consistent definition throughout the decade (unlike pending sales from NWMLS).
Both the red demand line and the blue supply line dropped in February. The demand side of the chart is just barely in buyer’s territory, but the supply side is so far on the seller’s side that the market is still strongly skewed toward sellers.
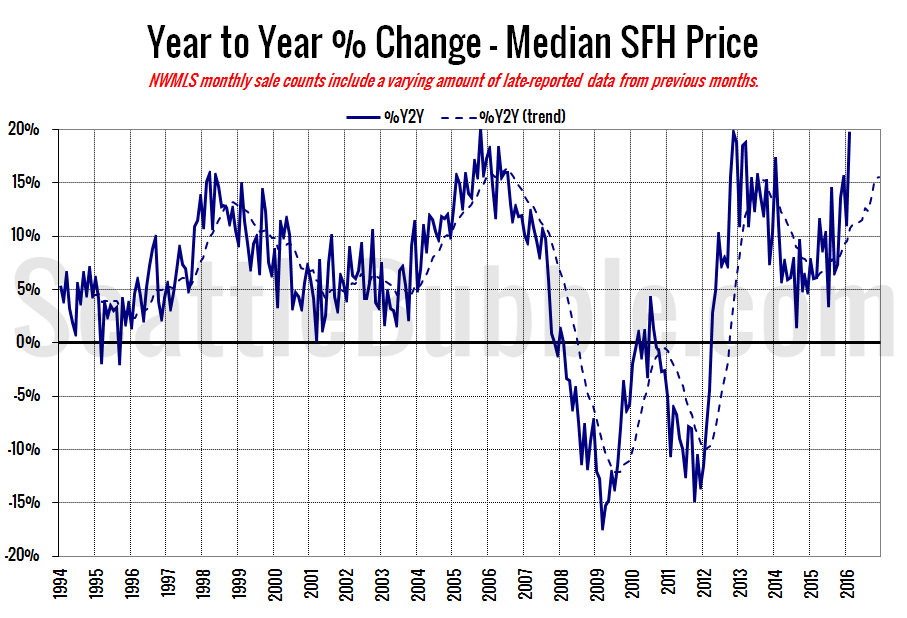
Here’s the median home price YOY change graph:
Year-over-year price growth shot up from +11.2 percent in January to +19.8 percent in February. That is the largest year-over-year increase we’ve seen in the single-family median home price since the peak gain of +20.0 percent in October 2005.
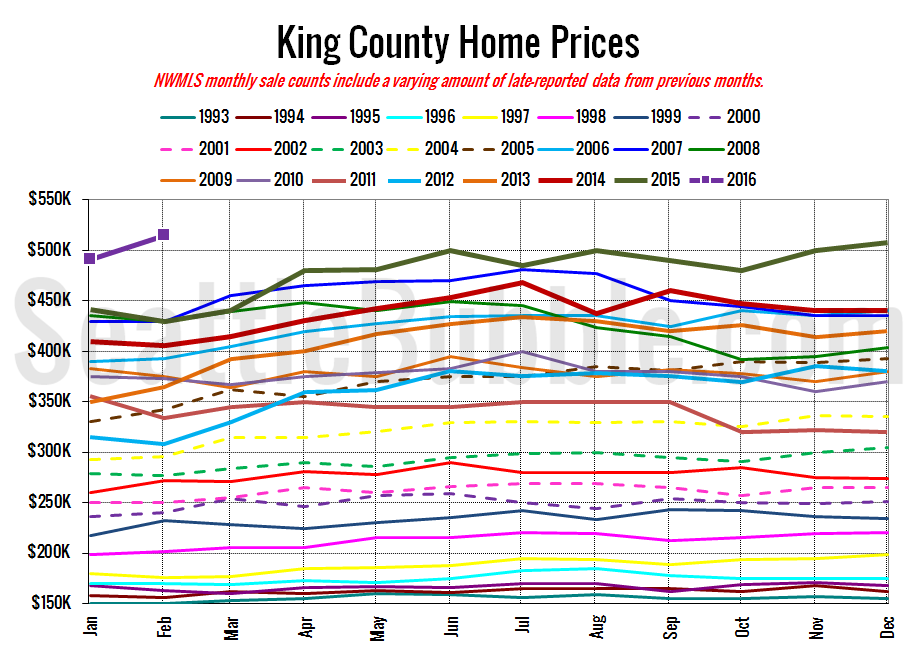
And lastly, here is the chart comparing King County SFH prices each month for every year back to 1994 (not adjusted for inflation).
The median home price blew out of the $480,000 to $500,000 range it oscillated between for most of last year with a strong new high point in February.
February 2016: $514,975
July 2007: $481,000 (previous cycle high)
Here’s this month’s article from the Seattle Times: King County home prices hit a new high
Check back tomorrow for the full reporting roundup.
