If you’re wondering about the lack of posts on these pages recently, the explanation is pretty simple: There just isn’t much to say. The Seattle-area housing market has been in a protracted boom period with ridiculously low inventory of homes for sale and rapidly-climbing prices for years now. In a lot of ways it looks like the housing bubble that was in full swing when I started this blog in 2005, but what’s going on behind the scenes is very different this time around. Is it possible that Seattle really is special this time around and the “bubble” won’t burst this time? … Maybe?
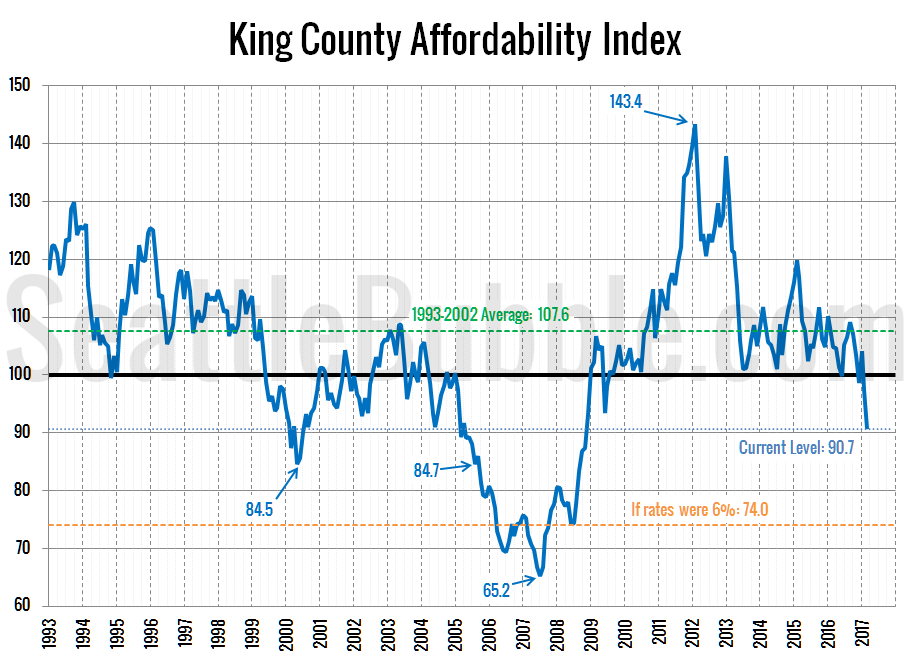
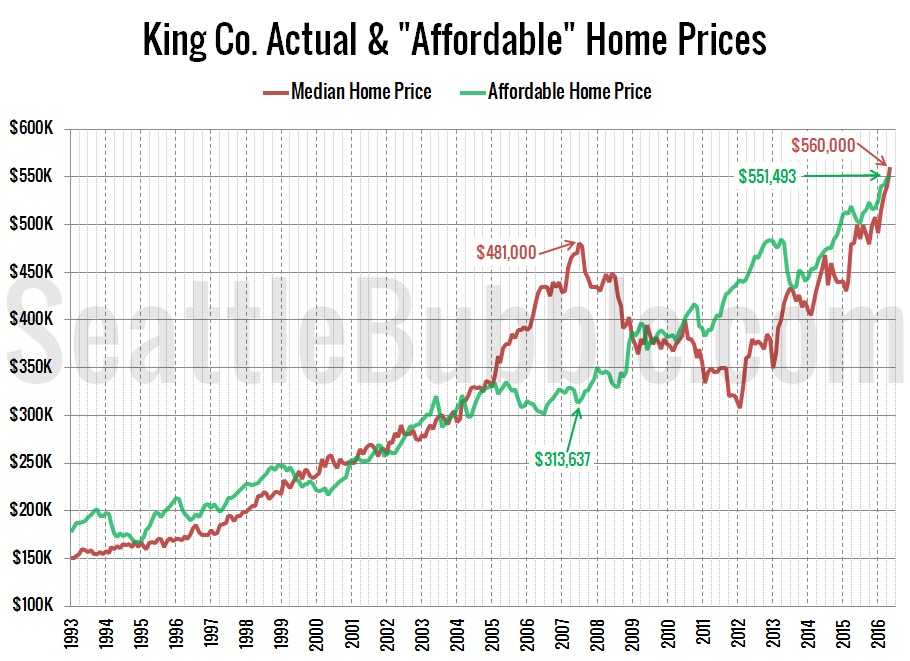
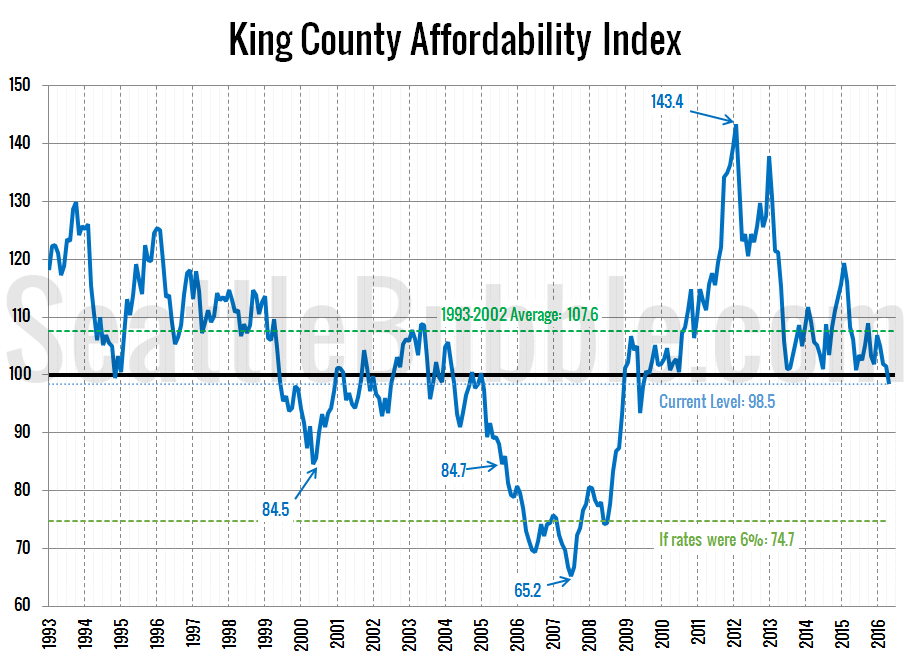
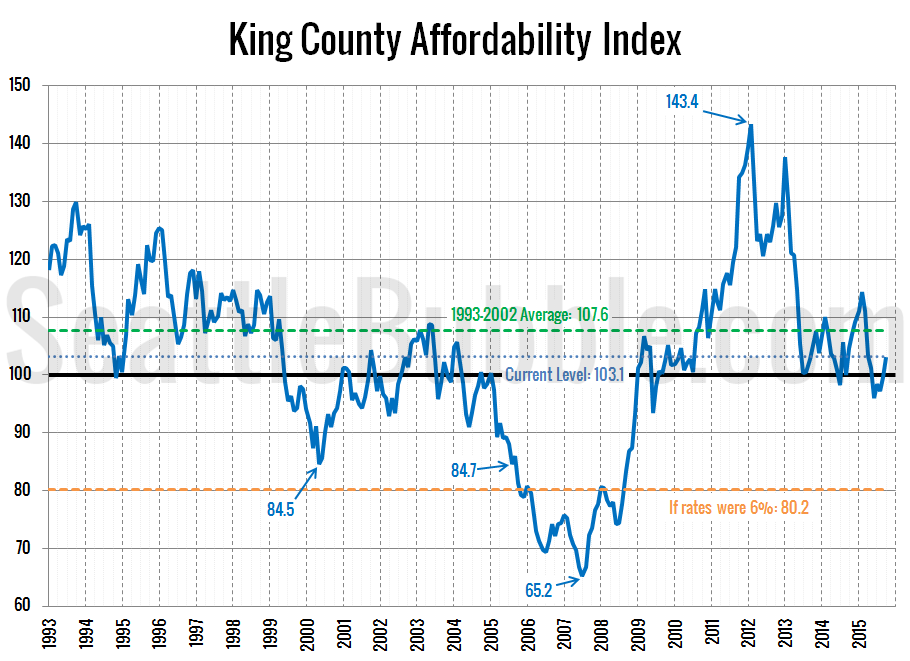
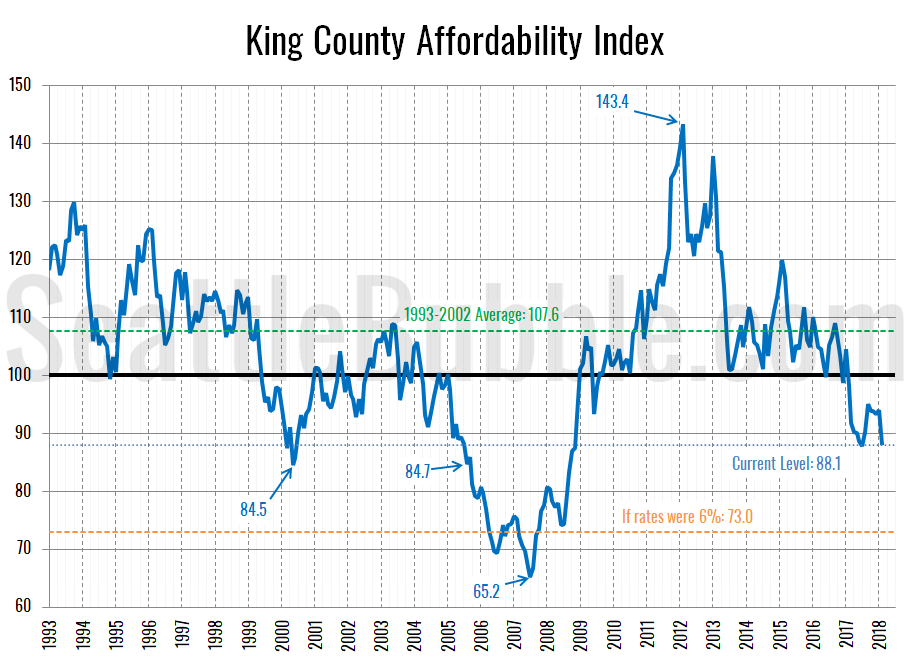
Anyway, I’ve been meaning to update more of the charts of the “fundamentals,” so let’s start with an updated look at our affordability index charts for the counties around Puget Sound.