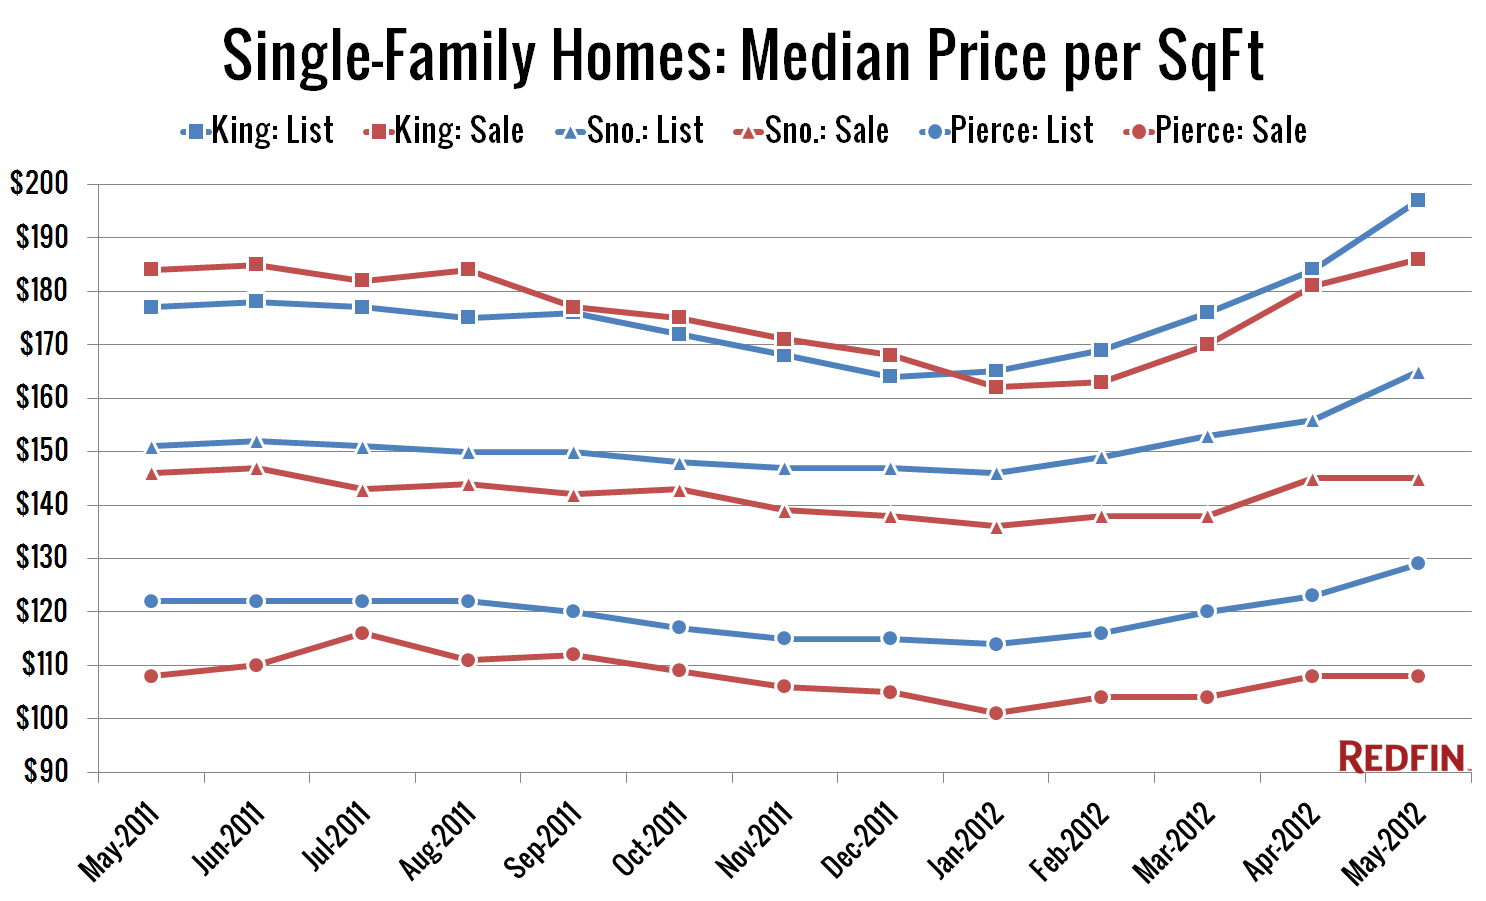
Full disclosure: The Tim is employed by Redfin. A few people requested some charts of the data in yesterday’s post going further back than just a year. Redfin doesn’t have data back through before the bust, but there is about two years of data available, so here you go. A year ago, price per square…
Tag: monthly-stats
Redfin: Seattle-Area Prices Creep Up Through Spring
Full disclosure: The Tim is employed by Redfin. It’s been quite a while since I’ve posted any of the monthly market stats published by my employer, but since I’ve been spending a lot more time than usual knee-deep in these spreadsheets lately, I thought I’d share a few charts from the May update (xls). First…
Redfin: Slow Sales, Little Heat in Seattle’s Housing Market
Full disclosure: The Tim is employed by Redfin. Last Week Redfin released their September market data. As is my tradition, I will be re-posting the heat map here. Here’s this month’s sweet Google Fusion Tables zip code heat map. You can zoom in/out, and click on a zip code to get the detailed September numbers…
Redfin: Capitol Hill & Wallingford Seattle’s Hottest Neighborhoods in August
Full disclosure: The Tim is employed by Redfin. On Monday Redfin released their August market data. The narrative is light this month, as we’re working on a new format, but I still wanted to post the heat map here, since I love heat maps. Here’s this month’s sweet Google Fusion Tables zip code heat map….
Redfin: Summer Not so Hot for Local Real Estate
Full disclosure: The Tim is employed by Redfin. Last Friday Redfin released their July market data. Here’s an excerpt from the narrative (which I did not write this month): Redfin Capitol Hill Team Lead agent Allie Howard says: “I give the summer of 2011 an “F” for frustration! Sellers are frustrated as prices of comparable…