A little over a year ago, I wrote a series of posts in which I argued that “shadow inventory” (foreclosed homes held off the market by the banks) was nearly non-existent. "Shadow Inventory" Conspiracy Theories Are Nonsense Shadow Inventory Gut Feelings, Rumors, & Anecdotes Undocumented Shadow Inventory Scarce in King County Despite all of the…
Tag: mythbusting
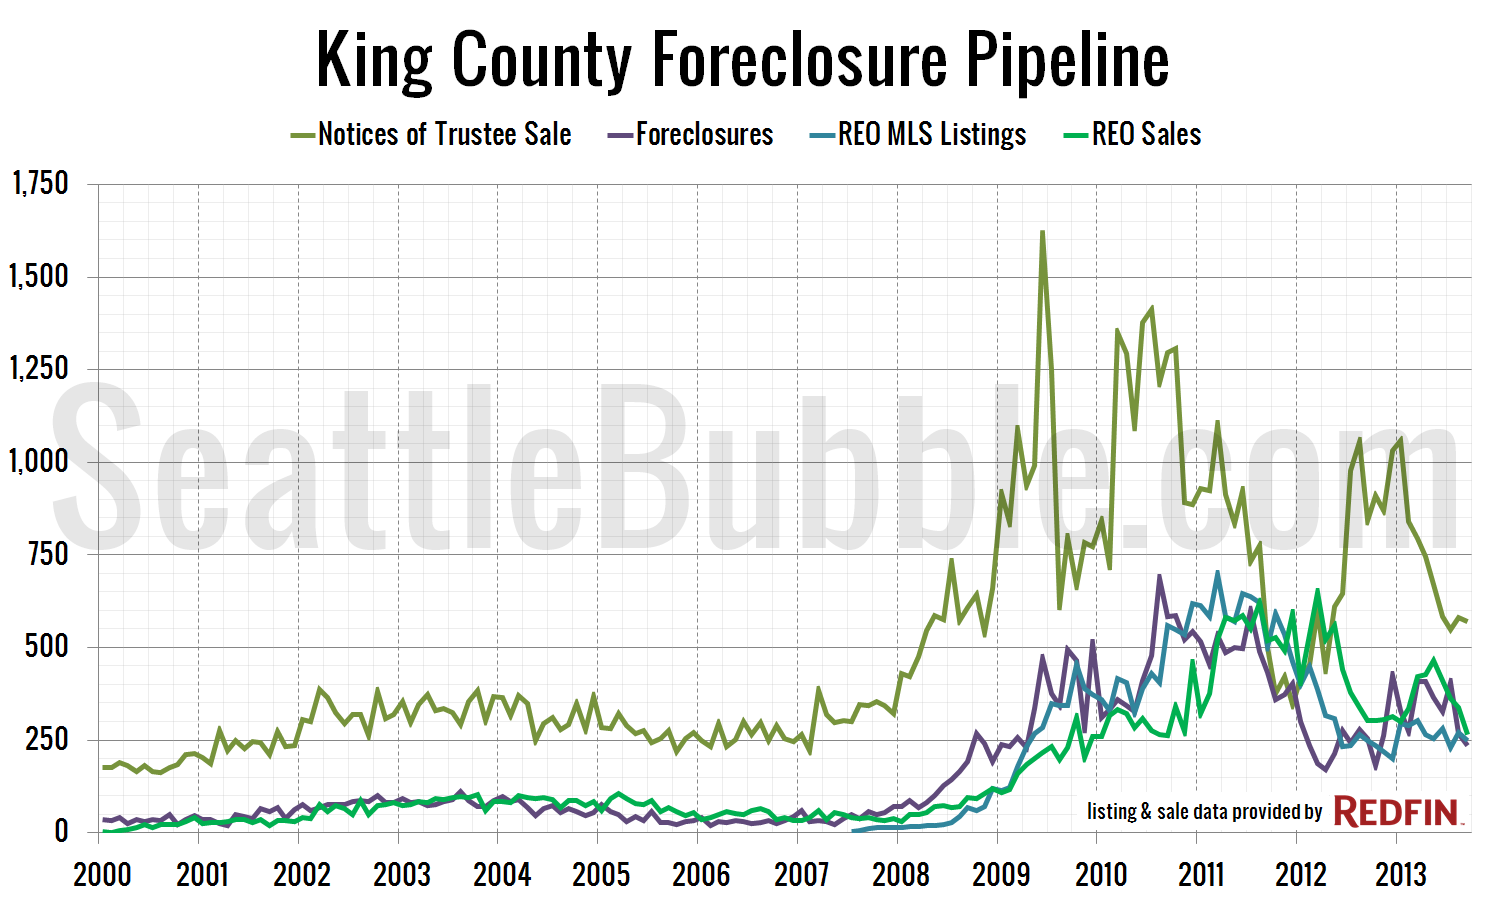
Undocumented Shadow Inventory Scarce in King County
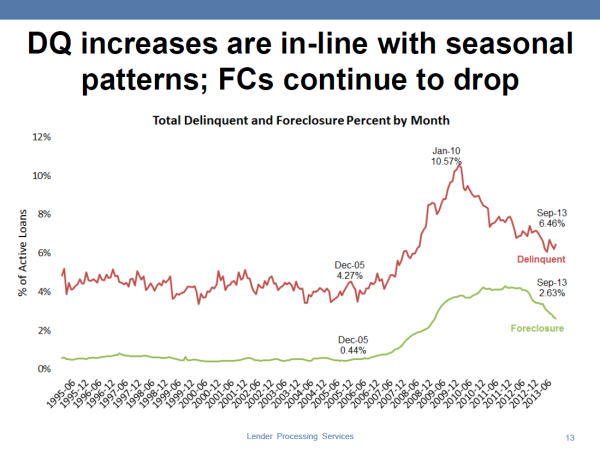
Don’t worry: This will be my last post about the shadow inventory issue for quite some time. In last Friday’s post about shadow inventory, “Haybaler” shared a great link in which Calculated Risk reported LPS delinquency data for September. This data addresses the main complaint some of you have raised about my previous analysis of…
Shadow Inventory Gut Feelings, Rumors, & Anecdotes
A number of you took issue with my data-backed claim that foreclosures are proceeding in a normal, orderly fashion and shadow inventory is a non-issue in the Seattle area. Your main objection seems to be based on a belief that there are large numbers of homes with mortgages that the borrower has stopped paying months…
“Shadow Inventory” Conspiracy Theories Are Nonsense
For some reason, a couple weeks ago the Seattle Times website featured a syndicated article about RealtyTrac’s “Vampire REO” nonsense, which in addition to being a completely worthless bit of non-news, was already weeks old when it appeared on the front page of the Seattle Times website. In the comments to the article I did…
Checking Up on the “Forced Savings Plan” Myth
Please consider the following excerpt from a post I wrote that was originally published on the personal finance blog Get Rich Slowly (and later here): …if home buying is like a savings plan, it’s probably the worst savings plan on Earth. Would you voluntarily sign up for a savings plan where well over half of…