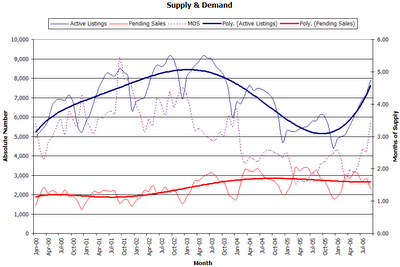
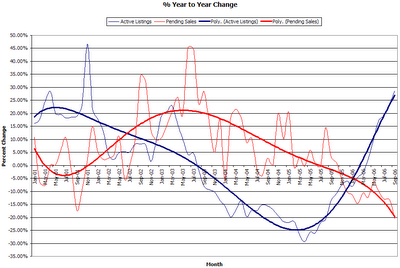
It’s that time of the month again. Time for fun with numbers. September figures from the NWMLS have been posted. King County Residential inventory jumped even more than I was expecting, up 28.79% from last year. Sales tanked nearly 20% from August, and are down 20.59% from last year. Median sales price for single-family homes in King County actually decreased from August, down to $425,000 (up 11.48% from September 2005).
It is worth noting that the while inventory commonly increases from August to September, last month’s 10% jump is the largest increase over that time period in at least the last seven years. Likewise, sales tend to decline in September, but last month’s nearly 20% drop from August is the largest September drop since 2001. Furthermore, the last time that the median sales price from August to September dropped by more than last month’s 2.30% was 1998.
Also interesting is the fact that the “months of supply” number (inventory / pending sales) shot up almost a full month—the largest jump since December 2000—from 2.54 to 3.49, a value not seen since Winter 03-04. If that rate of change stays steady (I doubt it will), we will reach six months of supply (generally seen as a “balanced market”) before the new year.
As is traditional, I have uploaded an updated version of the Seattle Bubble spreadsheet for your number-crunching pleasure. Don’t forget that you can always find the link to the spreadsheet on the sidebar.
Here are the supply & demand graphs.
Check out those curves.

