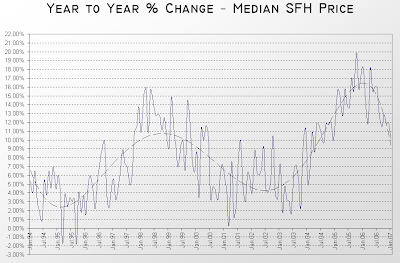
Just for kicks, let’s take another look at the home price YOY change graph that I posted on Wednesday.
I noted that the downward curve on the right that represents the last nine months looks fairly steep. But just how steep is it, compared to the rest of the graph?
In order to get a feel for the “cyclic nature of the market” I ran some calculations. Since things were slowing down at the beginning of the available data (1993), I defined a complete cycle as a slowdown, trough, speedup, plateau. I calculated the average month-to-month change in year-over-year home prices for each slowdown, trough, speedup, and plateau.
In other words, when “appreciation” was on the rise, how quickly was it rising? When it was declining, how quickly was that? I did a little number-crunching, and here are the results.
Cycle #1: January 1994 — June 1998
Slowdown: January 1994 — March 1995
Median YOY Start: +5.33%
Median YOY End: -1.77%
Total Change: -7.10 points
Time Elapsed: 14 months
Average Monthly Change: -0.51 points
Trough: March 1995 — September 1995
Median YOY Start: -1.77%
Median YOY End: -1.82%
Total Change: -0.05 points
Time Elapsed: 6 months
Average Monthly Change: -0.01 points
Speedup: September 1995 — February 1998
Median YOY Start: -1.82%
Median YOY End: +15.10%
Total Change: +16.92 points
Time Elapsed: 29 months
Average Monthly Change: +0.58 points
Plateau: February 1998 — June 1998
Median YOY Start: +15.10%
Median YOY End: +14.67%
Total Change: -0.43 points
Time Elapsed: 4 months
Average Monthly Change: -0.11 points
Cycle #2: June 1998 — April 2006
Slowdown: June 1998 — March 2001
Median YOY Start: +14.67%
Median YOY End: +0.35%
Total Change: -14.32 points
Time Elapsed: 33 months
Average Monthly Change: -0.43 points
Trough: March 2001 — June 2003
Median YOY Start: +0.35%
Median YOY End: +1.72%
Total Change: +1.37 points
Time Elapsed: 27 months
Average Monthly Change: +0.05 points
Speedup: June 2003 — October 2005
Median YOY Start: +1.72%
Median YOY End: +20.00%
Total Change: +18.28 points
Time Elapsed: 28 months
Average Monthly Change: +0.65 points
Plateau: October 2005 — April 2006
Median YOY Start: +20.00%
Median YOY End: +18.17%
Total Change: -1.83 points
Time Elapsed: 6 months
Average Monthly Change: -0.31 points
Cycle #3: April 2006 — ???
Slowdown: April 2006 — Present
Median YOY Start: +18.17%
Median YOY Present: +10.13%
Total Change: -8.04 points
Time Elapsed: 9 months
Average Monthly Change: -0.89 points
As you can see, the slowdown we are currently experiencing is nearly twice as rapid as either of the two previous slowdowns since 1994. Clearly this does not tell us anything about what is going to happen in the near future, but it’s definitely an interesting point to note, and one that you’re not likely to read in the local newspaper or the blogs by those in “the industry.”
Down and down it goes, where it stops… nobody knows.
