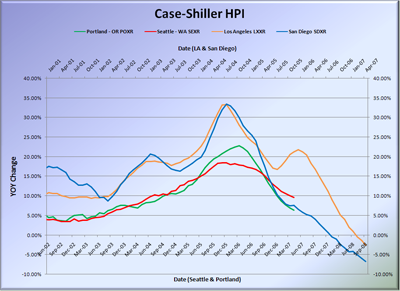
The latest Case-Shiller Home Price Indices data came out yesterday. The data runs a few months behind, so this release covers April. Here’s Aubrey Cohen’s take on the numbers in the P-I:
Seattle continues to defy a national trend of declining home values, but city house price increases are slowing, according to a Tuesday report.
Seattle-area prices for existing houses in April were up 1.3 percent from February and 9.6 percent from April 2006, according to Standard & Poor’s S&P/Case-Shiller Home Price Indices.
Both were the largest increases among the indices’ 20 major metropolitan areas, with Dallas equaling the monthly boost.
Pretty much the standard, rah-rah fluff. Aren’t we special, yadda-yadda.
But wait, there’s more! (Emphasis mine.)
But Robert Shiller, chief economist at MacroMarkets LLC, noted in a statement that Seattle’s year-to-year price increase was down from 17.8 percent in April 2006.“No region is immune to the weakening price returns,” he said.
The Seattle area’s year-to-year price increases have declined for 14 months, and April’s 9.6 percent rise was the lowest since May 2004.
“That is still a marvelous growth rate,” said Maureen Maitland, vice president of index analysis for S&P, in an interview Tuesday. “(Seattle) has held out quite a lot compared with others.”
…
Seattle also may be behind the cycle because the previous tech bust in 2001 delayed its entry into the latest housing boom, she said.
Seattle’s appreciation peaked in November 2005 — 14 months after the 20-city index. Hard-hit cities such as Detroit and Boston peaked in late 2003 and early 2004.
What’s that you say? Seattle may just be “behind the cycle”? Now where have I heard that before? Oh yeah, right here. Over and over.
Here’s another graph that attempts to visualize this theory. This one plots Seattle & Portland vs. Los Angeles & San Diego year-over-year price appreciation according to Case-Shiller. I’ve shifted San Diego and Los Angeles to the right by 18 months in order to roughly line up the period of peak appreciation.
Those curves sure look similar to me (note: “similar” not “identical”). If Seattle & Portland’s respective housing bubbles play out similarly to San Diego and Los Angeles, next Spring and Summer could be very interesting in the Pacific Northwest.
(MacroMarkets LLC, S&P/Case-Shiller HPI, 06.2007)
(Aubrey Cohen, Seattle P-I, 06.26.2007)
