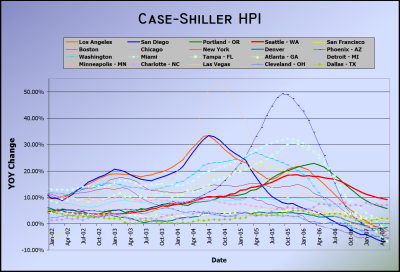
By popular request, here is a version of yesterday’s graph that includes all 20 cities tracked by Case-Shiller, with no time-shifting monkey business going on. Click the image for a super-sized version.
When I look at the graph, I see that Seattle and Portland—for whatever reason—seem to have arrived at the appreciation-spike party late, and are therefore (as one would logically expect to follow) late to see declines. The reason I time-shift the graphs I usually place up here is simply to provide a visual of just how strong the delayed correlation seems to be.
The real winner here appears to be Charlotte, NC, where they rode out the wild years of ’04-’05 with healthy 3-5% appreciation, and now appear to be experiencing increasing appreciation, in the 7-8% range. If any of the Case-Shiller tracked cities are “bucking the trend,” it’s Charlotte, not Seattle (or Portland). Better get in on the Charlotte housing bubble now, before you’re priced out forever!
