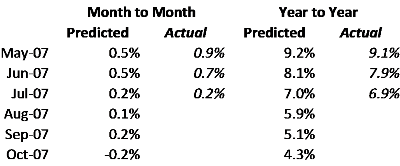
Many of you may have read my previous post that tied the performance of the Case-Shiller index to the growth in inventory. Since then, I’ve done a bit more tweaking of that model – which has proven to be reasonably consistent with actual results over the past few months. Better on the YoY figure than the MoM, but reasonably close.

Based on that view, I’m predicting we will roll over into negative performance on a month to month basis by October of this year – probably earlier given all the tightening that has gone on in the credit markets in August and September. July saw month to month growth of just 0.2% in what is typically one of the strongest months of the year for price appreciation.
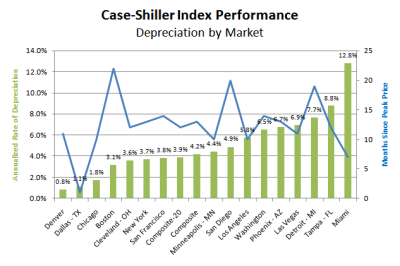
So if we are basically at the top of this cycle, and likely to head down for at least a while – what is the potential for price decreases? To bound this, I think it is interesting to look at the price changes in other markets tracked by Case-Shiller. Sixteen of the twenty markets they track are declining, and have been doing so from one month (Dallas) to over 20 months (Boston). The annualized rate of price depreciation ranges from ~1% to almost 13% (Miami) – with the bulk of markets tracking at about 4% per annum.
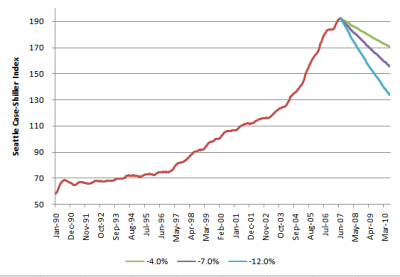
I thought it would be interesting to plot a couple of scenarios for Seattle to see the impact would be if we are hit by average, above average, or “Miami-like” depreciation. Note that this is NOT a forecast, it’s just fodder to fuel the conversation about what you’d have to believe in order for the market to decline significantly.
So, here are some things to think about based on a 3 year downturn:
- 4% Scenario: At an average rate of decline, the market would fall about 11.3%. This would send prices back to the March 2006 level.
- 7% Scenario: This is the decline seen in markets like Phoenix and Las Vegas. A 7% per year decline would result in a total fall of about 19% – sending prices back to the level of July 2005.
- 12% Scenario: This is the most extreme price drop C-S has shown, close to what Miami prices have done (albeit for less than a year). Three years at this rate would drive prices down 30.4% from July – back to the level of July 2004.
As I said, this is not a forecast. These are “what if” scenarios, based on real-life experiences in other bubble markets. I do think this view points how extreme a downturn has to be in order to drive prices down to the levels seen at the turn of the century, especially in light of the experience of markets like Boston and San Diego. It will be interesting to see how long it takes this situation to play out.

