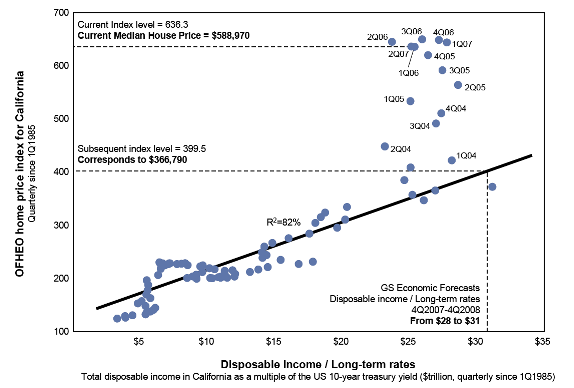
I ran across this very interesting analysis of the California real estate market by Goldman Sachs this weekend (PDF alert!). It is the author’s contention that in the past, changes real estate prices could be explained by two factors: disposable income and interest rates. They then go on to demonstrate, as shown below – how accurate this model was from 1985 to 2003. It’s pretty simple, but it makes a ton of sense – the amount that buyers have available to spend and the amount it costs them to borrow drive prices. And the model explains 82% of variation in home prices as represented by the OFHEO index. Genius!

Then in 2004, values started to diverge from this long term trend. Here’s how the author explains:
House prices are significantly over-valued in California
Our house price model indicates that Californian homes are 35-40% above the price range implied by current and forecast economic conditions (compared to 13-14% over-valuation nationally). As of August the median house price in California was $589K, but economic conditions support prices between $350-380K; material price declines are likely, in our view. From 1985 to 2003, 82% of quarterly variation in the OFHEO index for Californian home prices could be explained by two factors (state-level disposable income and interest rates); but this relationship broke down in 2004. We believe that sales of “affordability products” (e.g., subprime, option ARMs) – which spiked in 2004 – drove Californian home prices above levels supported by economic conditions; now that the secondary market for these products has evaporated, we expect home prices to return to normalized levels (as prices fall and disposable incomes grow).
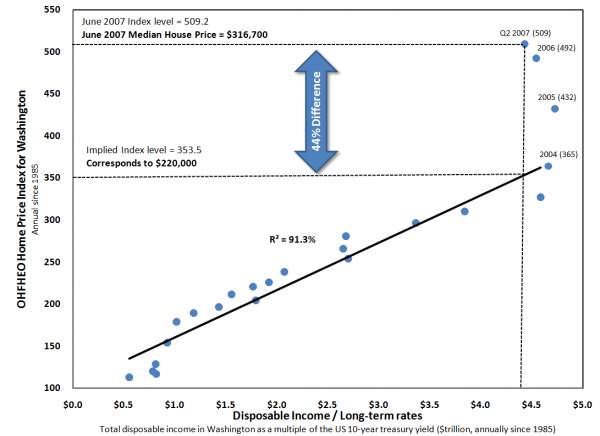
While I don’t get paid like a Goldman analyst, I figured that I could probably find the data to replicate their analysis and see what it said about Washington state. I was able to find most of what I needed, with the exception of two things: 1) I could only find annual data for disposable income, and 2) I had to estimate the 2nd quarter disposable income for 2007 (which I did on the basis of the growth in overall personal income growth). Given those two caveats, the results for Washington are remarkably similar to those for California.
While we see that the boom started a bit later (2004 results are right on the trend line), in 2005 and beyond the prices have soared far above the long term trend line. And in our case, the relationship between the underlying fundamentals and the changes in house prices appear to be even stronger than the GS California model: they explain 91% of the annual variation in home prices in Washington state.
So what does it tell us? Based on the Goldman Sachs approach – Washington home prices were 35% overvalued versus the long term trend at the end of 2006, and a whopping 44% overvalued at the end of the second quarter in 2007. Interesting stuff. We will see how accurate their forecast is for how things fall out. But one thing it points out for certain – the real estate market in our “special” state doesn’t really seem to be all that different than that of our neighbors to the south.
