October market statistics from the NWMLS are here.
Public press release and data pdfs have not yet been posted, but I will update the post with a link once they are. Update: Here is the NWMLS press release, with links to the public pdfs.
Here’s your King County SFH summary:
October 2007
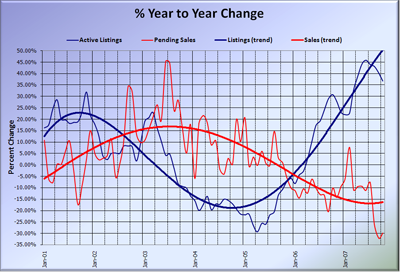
Active Listings: up 36.76% YOY
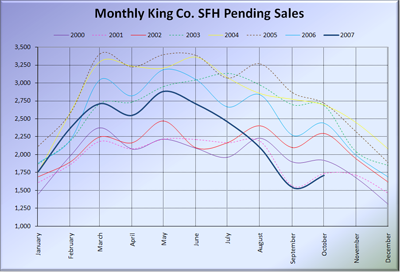
Pending Sales: down 29.88% YOY
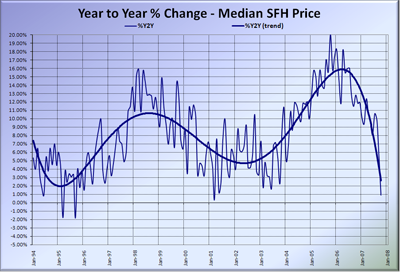
Median Closed Price*: $443,950 – up 0.90% YOY
Yes, that’s zero-point-nine percent. The median price dropped month-to-month for the third month in a row—the first time this has happened since before 2000, and only the third time since 1993. But again, let’s not focus too much on the median price, since it is a liar and doesn’t really tell us what’s going on.
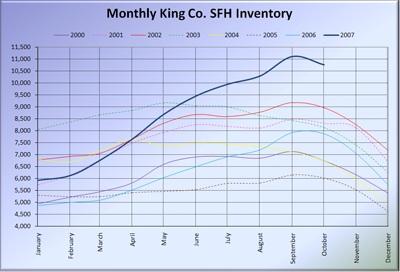
The growth in inventory slowed just a little, from the 40%+ YOY growth of the last five months to just under 40% YOY. Expect inventory to continue to decline through December, as it does every year, only to pick back up with a vengence in January.
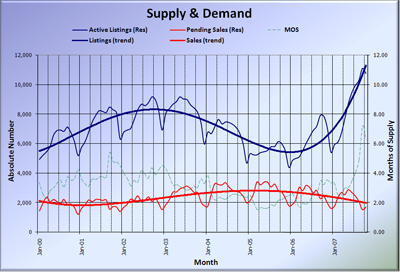
The total number of sales in October was up slightly from September, as it is most every year. This caused the Months of Supply to drop back slightly from last month, however it still remains in record territory at 6.29.
Update: Here’s the updated Seattle Bubble Spreadsheet, and here’s a copy in Excel 2003 format.
Here’s the supply/demand YOY graph:
Here’s the chart of supply and demand raw numbers:
And just because the incredibly steep drop at the end is so dramatic, I’ll bring the SFH Median YOY change graph back this month:
Here’s a new graph for you. It shows the total amount of SFH inventory on the market at the end of each month, with each year since 2000 overlayed on top of each other, so you can more readily compare them.
And here’s the same graph for pending sales:
Check back tomorrow for the news roundup. This should be fun…
