The latest data from Case-Shiller has been released. Let’s have a look at how Seattle is performing:
Down a quarter of a percent August to September.
Up 4.69% YOY.
Back to back month-to-month declines have as we have now seen from July to September have not happened since 1995. The NWMLS King County SFH Median for September was up 5.88%, which is much less divergent than we have seen in recent months, however I expect that the October data will show a difference in the opposite direction, with the NWMLS YOY change actually being lower than the Case-Shiller Index.
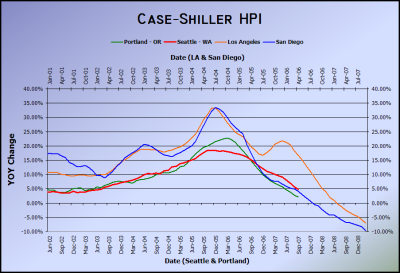
Here’s the usual graph, with L.A. & San Diego offset from Seattle & Portland by 17 months.
I hate to sound like a broken record here, but I’ll say again what I say every month: this graph is not meant to be viewed as predictive. It is posted merely as a curiosity to demonstrate how closely home prices in the Northwest cities are following the pattern of the Southern California cities, when a slight time delay is taken into account. We’ve finally broken down below the 5% yearly appreciation rate, so any month now it’s sure to level off. I know that is true because that’s what most of our local real estate professionals keep saying.
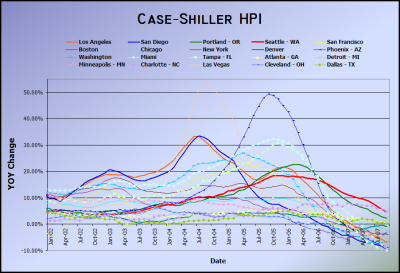
As has become the standard procedure, here’s an update of the graph with all 20 Case-Shiller-tracked cities, with no time-shifting.
It is difficult to tell from the graph, but September also marked the dethroning of Seattle from the “best performing” title (which we had held since September 2006). This position is now held by Charlotte, NC, which clocked in at 4.72% YOY change, versus Seattle’s 4.69%.
(MacroMarkets, Standard & Poors, 11.27.2007)

