Many thanks to Deejayoh for posting the NWMLS summary in my absence. By request, I am am posting the usual press release link, graphs, and spreadsheet update in addition to his timely post on the data.
Here is the NWMLS press release, with links to the pdf summaries.
Here’s your King County SFH summary:
December 2007
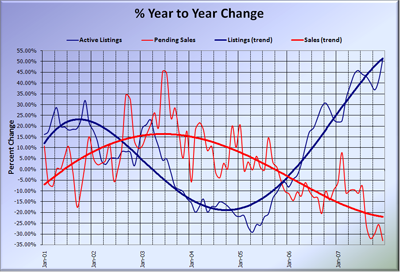
Active Listings: up 51% YOY (new record)
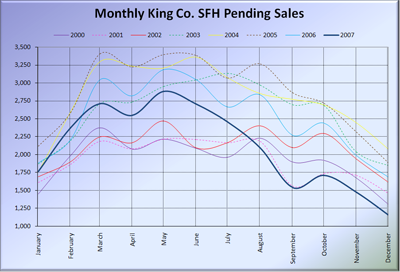
Pending Sales: down 33% YOY (new record)
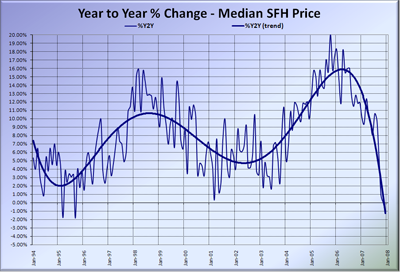
Median Closed Price*: $435,000 – down 1.14% YOY
Whoops. A negative number in median price YOY? That’s not supposed to happen!
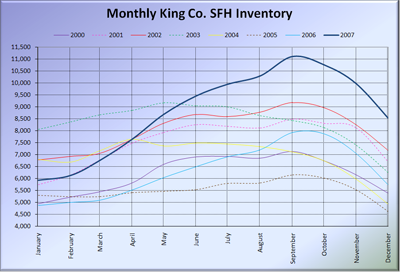
As absurd as it may seem, YOY inventory grew faster still, shooting up over 50%. The total number of sales dropped further in December, down to 1,086—11% lower than the now second-lowest month on record, December 2000. The months of supply grew to a new record high of 7.54.
Here is the updated Seattle Bubble Spreadsheet, and here’s a copy in Excel 2003 format.
Here’s the supply/demand YOY graph:
Here’s the chart of supply and demand raw numbers:
Here’s the SFH Median YOY change graph, complete with the dip below zero at the end:
And again, here are the direct year-to-year comparisons, so as to throw out any notion that the slowness of sales and high inventory is “seasonal.” It is not.


