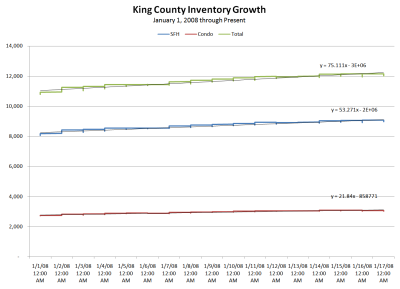
As a follow on to Tim’s post yesterday about December stats – the thing that jumped out at me from his post was the growth in inventory. Given that there have been a few comments on the blog about home sales picking up, I thought a data-driven look at what is happening with active listings would be interesting. This data is taken from Tim’s inventory logs, which are available at the upper-left corner of the blog. I used the feed in the third column, which has proven to be the most accurate in tracking month-end inventory levels.
As you can see in the chart above, the growth in listings has been incredibly steady throughout the month – nearly linear. The trend lines through the listing trackers show that we’ve been adding 53 SFH listings and 22 condos for a total of 75 new listings a day thus far this month. If you extend this trend through January 31, and add it to the reported end of month listings for December 2007, here is where we will end up:
Of course, this may not hold up – but it’s a pretty good indicator of why you can’t trust the “drive to work” survey to assess the overall market.

