Seattle got a little bit of attention in a recent Wall Street Journal story titled Housing Slump Starts to Hit Stronger Cities:
It’s getting harder to hide from the housing bust.
Tight credit, fragile consumer confidence and a weakening economy are slowing sales and depressing prices even in some places — such as the Pacific Northwest and North Carolina — that until recently had avoided the housing slump afflicting most of the country.
…
Some of the fastest increases in home listings have occurred in relatively strong markets. The inventory in the Seattle metro area counties of King, Snohomish and Pierce leapt 50% last year. At the end of December, when listings are lower than usual because of the holidays, the inventory there was enough to last 4.9 months, denoting a fairly balanced market — but up from a very lean 2.7 months at the end of 2006. In King County, the median price in December was down 2.6% from a year ago.Given the rise in supply, home prices in Seattle probably will fall further, says Glenn Kelman, chief executive of Redfin, a real-estate broker based there. “If you walk around town, you see cranes everywhere,” he says.
I guess Glenn figures that it isn’t really possible to be any more reviled than he already is by “traditional” real estate salespeople, so why not call it like he sees it. It’s nice to see the national media giving some attention to the Seattle market that is something other than the usual look what a great investment type of stories.
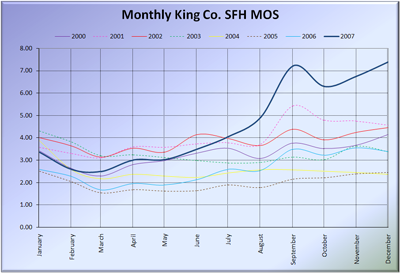
I’m not sure where the WSJ got their months of supply figures from though, because the numbers they quote don’t match any that I’ve seen from the NWMLS. They’re correct when they say inventory across King, Pierce, and Snohomish is up 50%, and prices in King are down 2.6%, as that data matches the “res + condo” figures from the NWMLS. However, when you divide the total inventory at the end of December by the number of pending sales (the traditional method for determining “months of supply”), you get 8.4 months of supply in December 2007 (not 4.9), and 3.8 in December 2006 (not 2.7). If anyone can figure out where those numbers came from, let me know. The NWMLS data can be found in the December 2007 Recaps linked here.
(James R. Hagerty, Wall Street Journal, 01.14.2008)
Update: In the comments Garth pointed me toward the chart that was included with the story, which I overlooked. In the chart, the “Overall Strength” of the Seattle metro area housing market is listed as “moderate.” In the footnotes, it indicates how they arrived at their months of supply figure:
Number of months that homes listed at year end would last at the average 2007 sales rate. Listings normally decline for seasonal reasons in December and rebound in January.
Taking the average of the whole year is a ridiculous way to calculate “months of supply,” for all the same reasons laid out in this post. In reality, the seasonal decline in sales rate is accompanied by a seasonal decline in listings, which tend to balance each other out. As you can see below, the “months of supply” really took off in late 2007.
