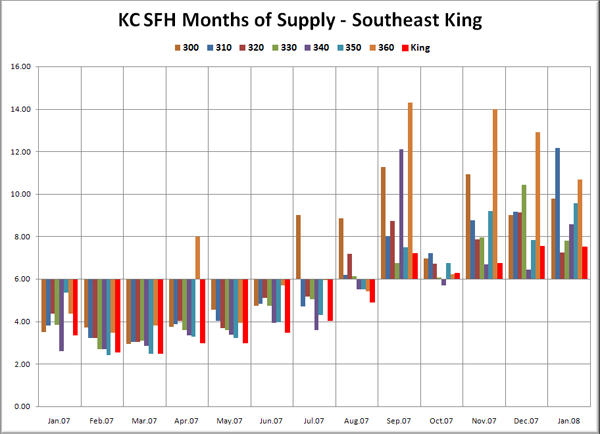
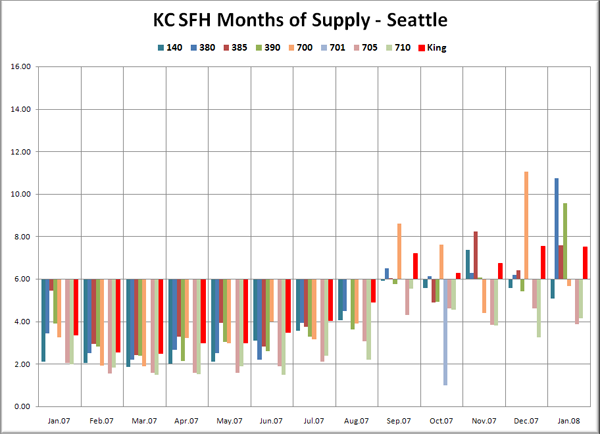
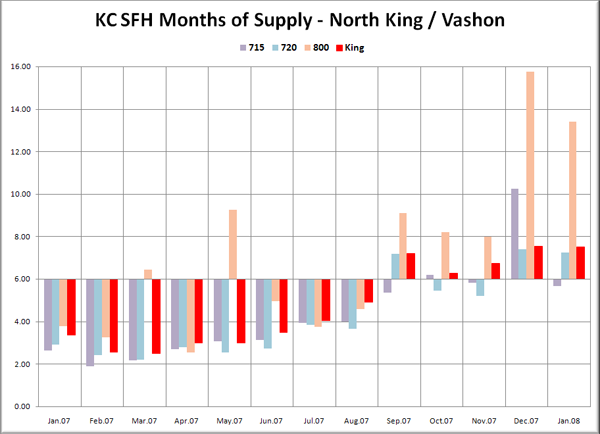
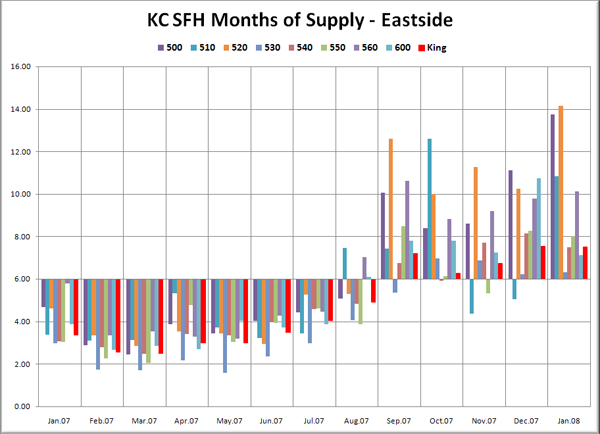
Let’s do some more number-crunching and neighborhood analysis. Here’s a detailed look at single-family house “months of supply” (MOS) over the last year, broken down by neighborhood. “Months of supply” is just a way of looking at the relationship between the number of homes on the market and the number of sales taking place.
To calculate months of supply for any area, you simply divide the total number of homes for sale by the number of pending sales. Generally 6 months of supply is considered a “balanced market,” while below 6 is a sellers market and above is a buyer’s market. Historically, the highest MOS for the King County area (post-1993, pre-2007) was 6.7-6.9 in the winter of 1994-1995 (based on the best available data, which is sketchy pre-2000). The current county-wide MOS is 7.54.
For the graphs below, I’ve again taken the “Res Only” data from the NWMLS King County Breakout pdfs for January 2007 through January 2008, this time plotting the monthly value of MOS for each area. I’ve broken the data into the same five graphs as the last neighborhood breakdown post. This time I’ve plotted them on a bar graph, centered vertically on 6.0 MOS, so that it is easier to visually tell the difference between a seller’s and buyer’s market. Each graph again has the same scale on the vertical axis and has the King County aggregate figure plotted in red, so they can be easily compared.
For a description of which neighborhoods each area encompasses, as well as a map of the areas and a link to the source data, visit this page.
Note: With only 8 sales in January, Area 100 actually shot all the way up to over 21 MOS, which is above the limit of the axis. In order to keep all five charts at the same scale and still have the other charts be at a reasonable height, I chose to clip the vertical at 16.
Note: Area 701 (Downtown Seattle) doesn’t have a bar most months because there was only one pending sale all year, in October, when there was also one listing, thus resulting in a MOS of 1.
Most neighborhoods followed right along with the King County aggregate, flipping from a seller’s market to a buyer’s market in September. However, there are a few notable exceptions. These include Enumclaw (Area 300), which jumped firmly into buyer’s market territory two months early with a MOS over 8. Also worth mentioning is Vashon Island (Area 800), which sported an MOS over 12 in December and January and Bellevue West of I-405 (Area 520), which has remained firmly at or above 10 MOS since September.
Clearly the strongest neighborhoods are in Seattle proper, with North Seattle neighborhoods (Ballard, Greenlake, Greenwood, Lake City, Northgate, Wedgewood, etc. – Area’s 705 and 710) showing the most resilience, still down in seller’s market territory with MOS’ in the 4-6 range. I would also like to point out that despite the presence of the Microsoft, three of the four Eastside neighborhoods nearest Redmond (Areas 520, 550 and 560) are all trending more toward a buyer’s market than the county as a whole, sporting January MOS of 14, 8, and 10, respectively. In fact, no Eastside neighborhoods remain seller’s markets, and the only ones with January MOS below the county-wide aggregate of 7.54 were East Bellevue (530) at 6.31, East of Lake Sammamish (540) at 7.48, and Juanita/Woodinville/Duvall (600) at 7.12.
The three strongest areas as of last month were Ballard/Greenlake/Greenwood (705) at 3.88, North Seattle (710) at 4.14, and West Seattle (140) at 5.08. Only two other areas remain seller’s markets: Queene Anne/Magnolia (700) and Richmond Beach/Shoreline (715). The three weakest areas were Eastside South of I-90 (500, which includes Issaquah) at 13.74, Bellevue west of I-405 (520) at 14.14, and Jovita/West Hill Auburn (100) at a staggering 21.38.
Does a MOS in the “buyer’s market” range indicate that now is a good time to buy in a given neighborhood? Not necessarily, and certainly not when it has only been in that range for a few months. If MOS stats stay consistently above six for a year or more, I believe we will really start to see some earnest price drops. Housing markets move very slowly. Only after the supply and demand situation has had a large amount of time to work itself out will you start to see a real effect on prices. “Buyer’s market” status just means that people selling their homes are facing a lot of competition for fewer buyers. It does not mean that now is a good time to rush out and buy, in my opinion.


