Many of you are aware of the “Residential Property Index” published for the top 25 MSAs by Radar Logic. Radar Logic has a similar business model to MacroMarkets with the Case-Shiller Index (e.g., creating housing-based contracts to be traded on a futures market) but there are some key differences in the way that they calculate their index. Here is a quick overview:
- Radar Logic’s index is based on ALL sales in a market. They do not ignore any sales that appear to be outliers. As such, Radar Logic does not use a “paired sales” methodology
- As a means to make transactions comparable, Radar Logic tracks markets based on the price of a house per square foot, rather than the overall price of the house
- Radar Logic reports their index daily – not monthly. The data is published on their site 60 days in arrears (so as of the date of this analysis, prices were available through February 5)
- In order to smooth the daily impact of low sales volumes, etc, they offer rolling 7 and 28 day averages. The 28-day average is the one most comparable to other indices.
- Like Case-Shiller, the reporting unit for Seattle is the MSA – which includes King, Snohomish and Pierce counties.
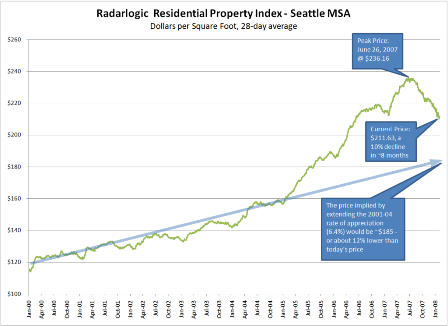
The index for Seattle shows a fairly familiar picture. A market that peaked in June of last year, that has fallen steadily since then, and has just recently turned negative on a year over year basis. I was interested in how fast things were off from the peak. When one looks at the rate of decline since the peak in June, things look a little different.
click image to expand
According to Radar Logic – prices in Seattle peaked on June 26, 2007 at $236.16 per square foot. Since then, prices have dropped fairly steadily to their current level of $211.63. That’s a drop of 10.4% in just over 7 months. On an annualized basis, this means prices per square foot in the Seattle MSA are dropping at a rate of 17%. What I also found kind of interesting in looking at this chart is how consistent the rate of appreciation appeared to be between 2000 and 2004. As you can see by the line I’ve added, it was almost linear at ~6.4% per year. If you extend this rate of appreciation through today, you’d have seen prices at about $185 per square foot – or 12% under current levels.
The fact that we’re only 8 months past the peak is very important. The papers are still reporting the year over year changes, and interpreting the lack of a significant drop as evidence that Seattle has dodged the bullet. However, as this index (and Case-Shiller, and the median) shows, even if the market is able to trade sideways for the next 4 months – we are still looking at double digit price drops in July.
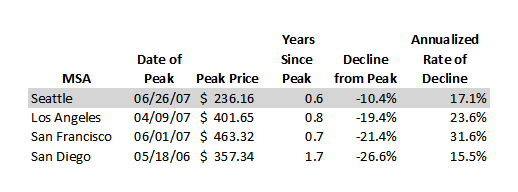
Since Radar Logic also offers indices for 25 other MSAs, here is a comparison to some other West Coast markets:

As you can see, Seattle again looks most similar to San Diego in the scale of our downturn – and in this index we lag that market by 13 months. Interestingly, San Francisco and Los Angeles seemed to have peaked much closer to Seattle according to this measure. Like Seattle, all of these markets have already booked double digit declines on a square foot basis inside of a year. The Bay Area (San Francisco) seems particularly hard hit on this metric – tracking to nearly a third off in the space of a year.
At the end of the day, this is just one data point – but when I get enough of them all pointing in the same direction, I start to think I’m on to something!
