Let’s check in on the NWMLS statistics from around the sound.
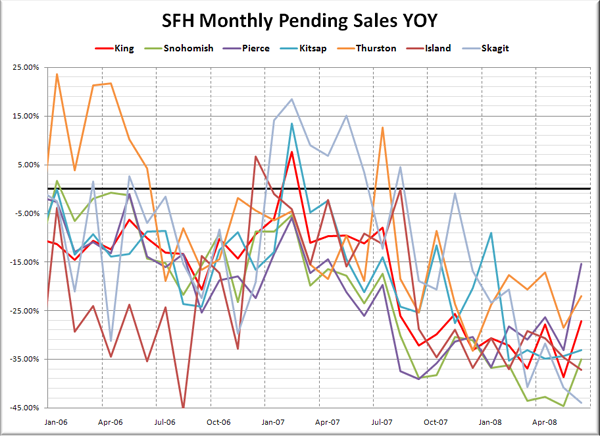
Here’s where the YOY stats stand for each of the six counties as of June 2008:
King – Price: -4.3% | Listings: +25.4% | Sales: -27.2% | MOS: 6.0
Snohomish – Price: -9.0% | Listings: +8.1% | Sales: -35.0% | MOS: 8.0
Pierce – Price: -6.6% | Listings: -4.6% | Sales: -15.3% | MOS: 7.4
Kitsap – Price: -12.0% | Listings: +5.3% | Sales: -33.1% | MOS: 10.3
Thurston – Price: -7.5% | Listings: -9.3% | Sales: -22.0% | MOS: 6.1
Island – Price: -11.8% | Listings: +12.1% | Sales: -37.2% | MOS: 14.6
Skagit – Price: -14.5% | Listings: +6.9% | Sales: -44.0% | MOS: 10.4
Following below are the graphs you’ve come to expect. Click below to continue reading.
These graphs only represent the market action since January 2006. If you want to see the long-term trends, feel free to download the spreadsheet (or in Excel 2003 format) that all of these graphs come from, and adjust the x-axis to your liking. Also included in the spreadsheet is data for Whatcom County, for anyone up north that might be interested.
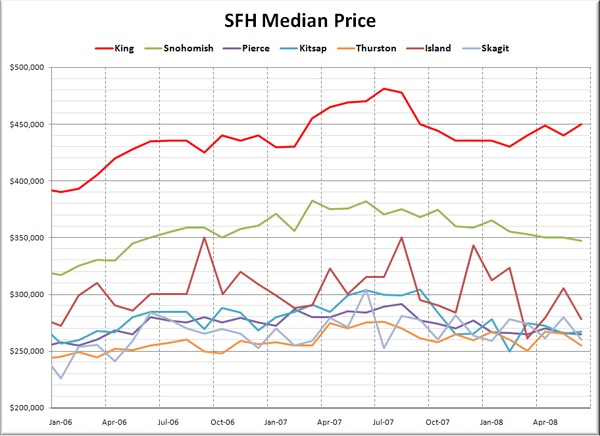
First up, it’s raw median prices.
King and Kitsap counties were the only two Puget Sound counties to see a median price bump from May to June. Everyone else declined between $1,000 (Pierce) and $27,000 (Island). Doesn’t look like much of a bottom anywhere just yet.
Here’s how each of the counties look compared to their peak:
King – Peak: July 2007 | Down 7%
Snohomish – Peak: March 2007 | Down 9%
Pierce – Peak: August 2007 | Down 9%
Kitsap – Peak: September 2007 | Down 12%
Thurston – Peak: July 2007 | Down 7%
Island – Peak: August 2007 | Down 21%
Skagit – Peak: June 2007 | Down 14%
Despite the supposed strength of the “core” markets of Seattle and Bellevue in King County, so far Thurston County holds the prize for the smallest decline.
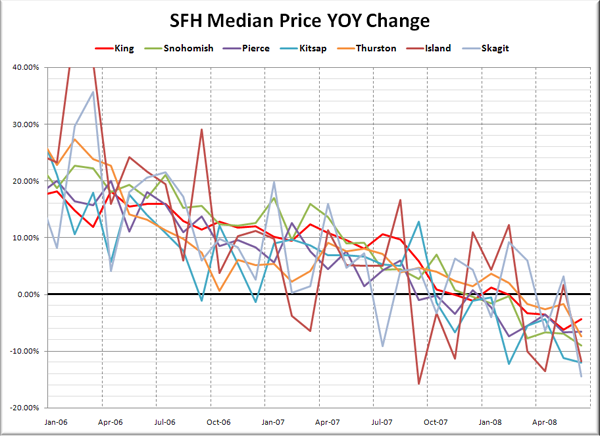
Here’s another take on Median Prices, looking at the year-to-year changes over the last two years.
Everybody’s in negative YOY territory, with King seeing the smallest YOY declines at -4.3% and Skagit’s -14.5% pulling up the rear.
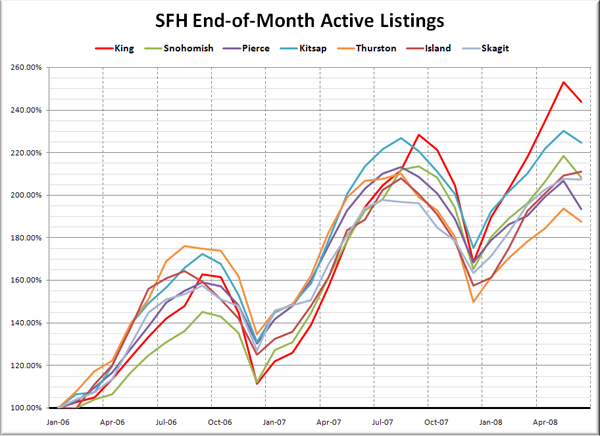
Here’s the graph of listings for each county, indexed to January 2006.
Only Island County saw listings continue to increase in June. In every other county, it would seem that a large number of sellers just giving up and pulling listings off the market caused the total number of listings to drop.
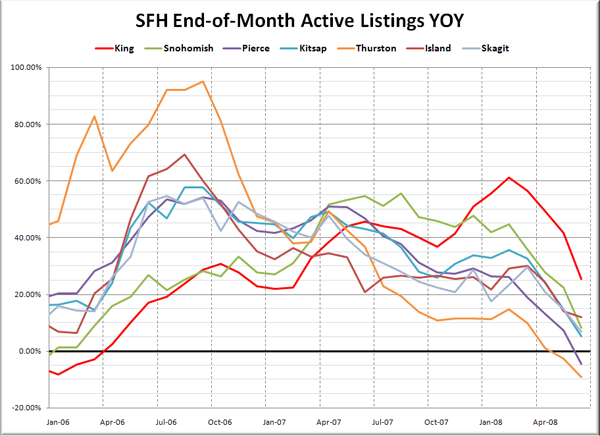
Here’s a look at the YOY change in listings.
Thurston and Pierce both dipped into negative YOY listings with the big delisting party in June.
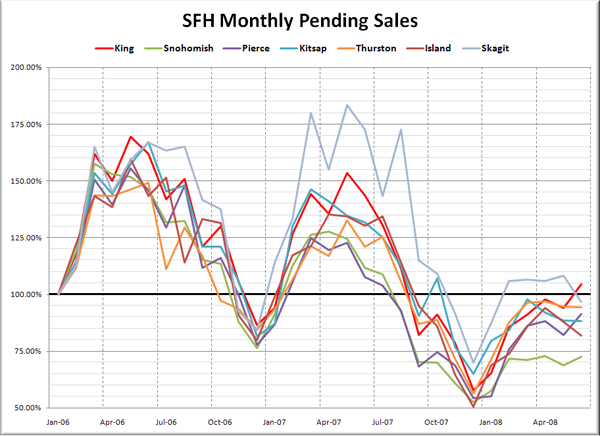
Lastly, let’s check out pending sales, also indexed to January 2006.
Snohomish County continues to sit in the gutter, while King County finally broke above the January 2006 sales mark. In June.
Lastly, here’s the YOY graph of sales:
Most counties had a little bump there, but even the best-performing county (Pierce) still had 15% fewer sales in June ’08 than June ’07.
With over 14 months of supply, prices in Island County are being absolutely hammered. Down 21% from the peak? Ouch. Hope none of you bought a second home on Whidbey as an “investment”…
