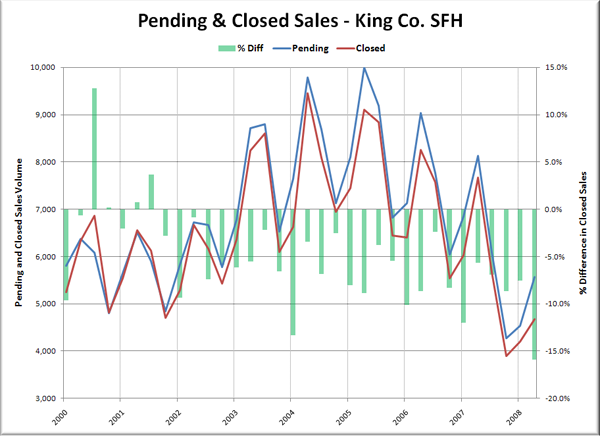
I mentioned this in the comments on a recent post, but I think it’s interesting enough to merit its own post. Since we regularly track pending sales as our measure of monthly sales volume in the monthly charts, I was curious to know whether the credit crunch has caused closed sales volume to diverge from pending.
What you see below is a graph of quarterly King County SFH sales volume according to the NWMLS, with closed sales offset by one month (since most closings take 30 days). The blue and red lines represent pending and closed sales (left axis), while the green bars represent the percent difference between closed sales and pending sales (right axis).
For some reason the first quarter has historically seen the largest difference between pending and closed sales, averaging 8.8% fewer closed sales than pending sales from 2000 through 2007. The first quarter of 2008 stayed close to that figure with 7.5% fewer closed sales than pending.
The second quarter average difference for 2000-2007 was 4.1%. 2008 second quarter closed sales were off 15.9% from pendings, the largest quarterly discrepancy to date.
I think this will be an interesting data set to keep an eye on as the year progresses. 16% of pending sales falling through is certainly not something to ignore when the long-term average 2000-2007 has been just 4-5%.
