As a follow-up to last Friday’s foreclosure news, let’s take a look at a couple charts of local foreclosures.
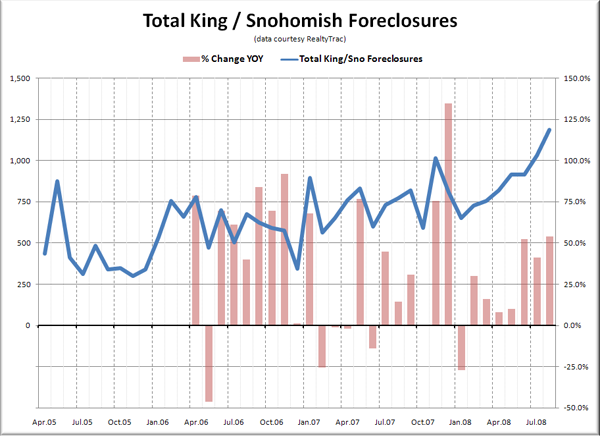
I contacted the folks at RealtyTrac to request historical foreclosure data for the Seattle area, and they were kind enough to provide me with their foreclosure data for King + Snohomish counties going back to April 2005. Here’s a long-term chart:
You can see that since July’s data showing 1,030 homes in some state of foreclosure (Default, Auction, or REO), we have been in uncharted post-2005 territory. August’s 1,185 foreclosures pushed even further into record highs.
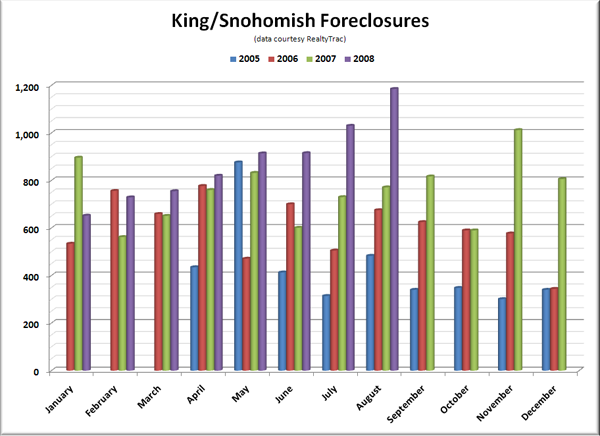
Here’s a chart comparing the foreclosures for each month:
We had a couple big spikes in November and December last year, then early this year things seemed to settle down close to 06-07 levels. But since June foreclosures have been noticeably shooting up.
Now that I’ve got this historical data as a basis, these will probably enter the rotation of graphs that are updated monthly.

