Let’s check in on the NWMLS statistics from around the sound.
Here’s where the YOY stats stand for each of the six counties as of August 2008:
King – Price: -11.2% | Listings: +16.0% | Sales: -16.1% | MOS: 6.8
Snohomish – Price: -9.4% | Listings: +2.3% | Sales: -19.4% | MOS: 8.1
Pierce – Price: -11.6% | Listings: -8.9% | Sales: -3.8% | MOS: 7.6
Kitsap – Price: -6.5% | Listings: -0.6% | Sales: -7.6% | MOS: 8.8
Thurston – Price: -7.6% | Listings: -9.9% | Sales: -6.1% | MOS: 5.9
Island – Price: -17.4% | Listings: +6.0% | Sales: -21.2% | MOS: 13.8
Skagit – Price: -9.3% | Listings: +8.1% | Sales: -41.1% | MOS:10.2
Following below are the graphs you’ve come to expect. Click below to continue reading.
These graphs only represent the market action since January 2006. If you want to see the long-term trends, feel free to download the spreadsheet (or in Excel 2003 format) that all of these graphs come from, and adjust the x-axis to your liking. Also included in the spreadsheet is data for Whatcom County, for anyone up north that might be interested.
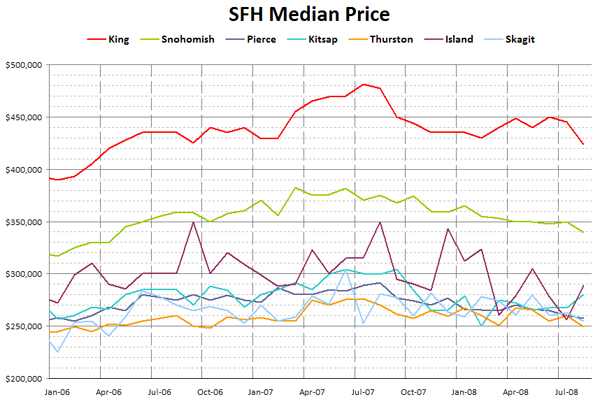
First up, it’s raw median prices.
Median prices declined from July to August in every county but Kitsap and Island. The largest drop this month was in King County, where the median price dropped over $21,000.
Here’s how each of the counties look compared to their peak:
King – Peak: July 2007 | Down 11.9%
Snohomish – Peak: March 2007 | Down 11.1%
Pierce – Peak: August 2007 | Down 11.6%
Kitsap – Peak: September 2007 | Down 8.1%
Thurston – Peak: July 2007 | Down 9.6%
Island – Peak: August 2007 | Down 17.4%
Skagit – Peak: June 2007 | Down 16.1%
With the slight increase in Kitsap’s median, that county now holds the prize for smallest overall decline, still at almost 10% off the peak.
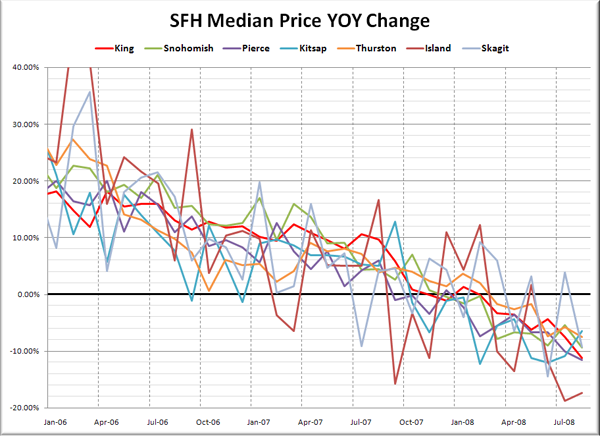
Here’s another take on Median Prices, looking at the year-to-year changes over the last two years.
Everybody’s in the negative this month, with year-over-year drops ranging from 6.5% in Kitsap to 17.4% in Island.
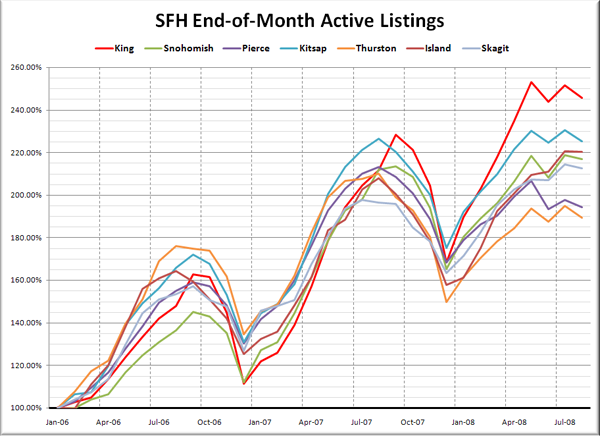
Here’s the graph of listings for each county, indexed to January 2006.
Listings seem to have reached a plateau across all seven Puget Sound counties, with King County still leading the pack in overall listing increases.
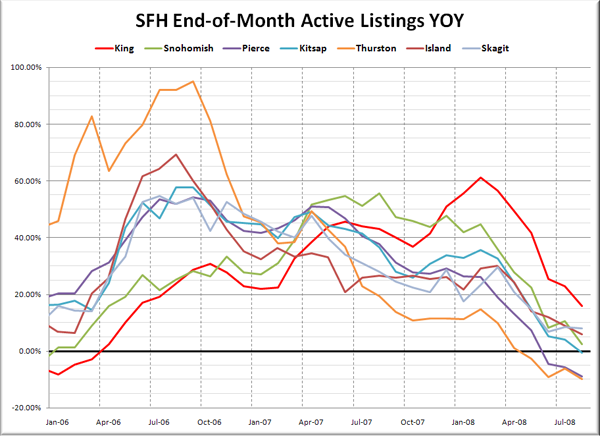
Here’s a look at the YOY change in listings.
Again, Thurston and Pierce are actually seeing fewer listings than this time last year, while King County is still at nearly +20%.
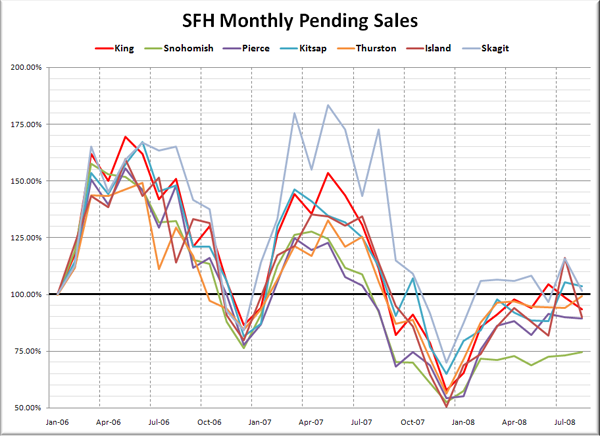
Pending sales, also indexed to January 2006:
Only Kitsap and Skagit were able to sell more homes in August than in January 2006. As predicted, sales volumes in King County declined from the month prior.
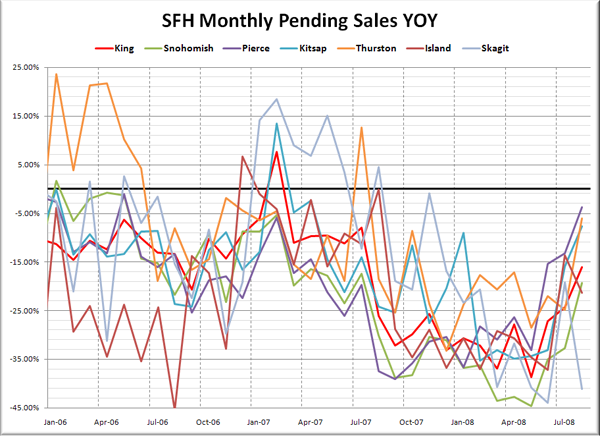
Lastly, here’s the YOY graph of sales:
There’s a definite upward trend in every county but Skagit, however the year-over-year sales data is still in the negative for every county in the Sound.
Island County is still taking the biggest hit in price and “months of supply,” but there really isn’t any county around the Sound where the real estate market could be described as anything other than weak, which is great news for homebuyers that are continuing to wait and watch as prices keep falling.
