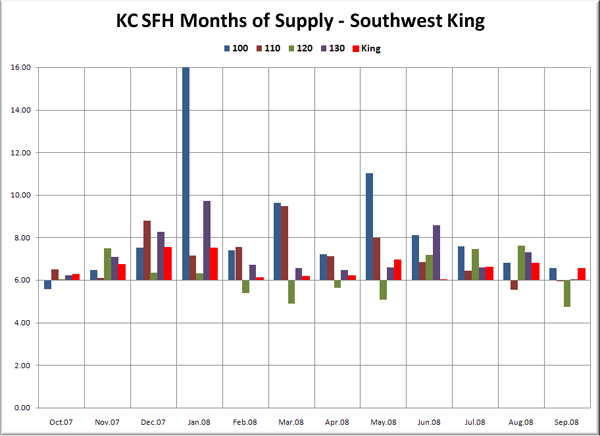
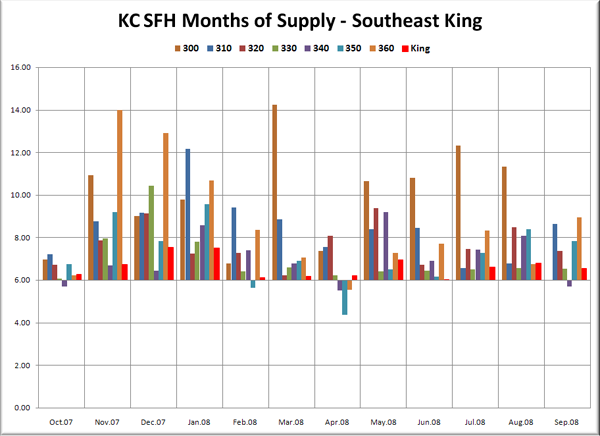
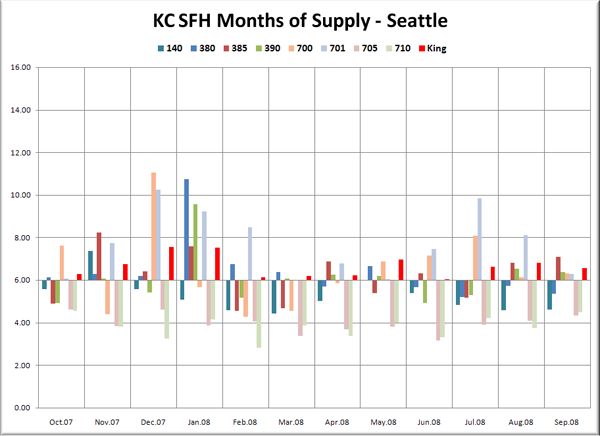
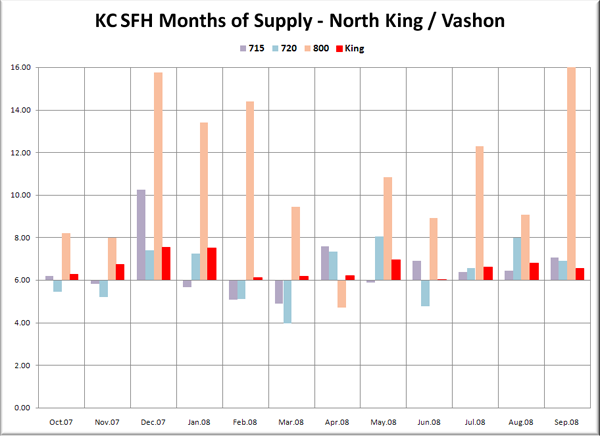
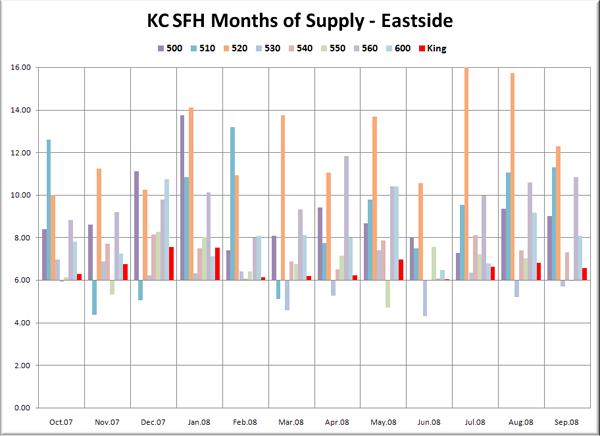
Let’s have a look at “Months of Supply” for the 30 NWMLS areas in King County. For an explanation of what months of supply means, please refer to the original neighborhood MOS breakdown post. Also, view a map of these areas here.
September MOS for King County as a whole came in at 6.57 (compared to 7.21 for September 2007 and 6.80 for August), bringing the current run to thirteen months—three times the previous record in the winter of 1994-1995.
In the graphs below, you’re looking at the MOS for the “Res Only” data from the NWMLS King County Breakout pdfs for the one-year period of October 2007 through September 2008. The bar graph is centered vertically on 6.0 MOS, so that it is easier to visually tell the difference between a seller’s and buyer’s market (i.e. – shorter bars mean a more balanced market). Each graph again has the same scale on the vertical axis and has the King County aggregate figure plotted in red on the far right, so they can be easily compared.
Note that there are a few areas that appear to have no bar at all for a given month—this represents an MOS value at or close to 6.0.
Note: Area 100 (Jovita/West Hill Auburn) was over 21 in January, and has been clipped.
Note: For Area 701 (Downtown Seattle) we’re using condo data.
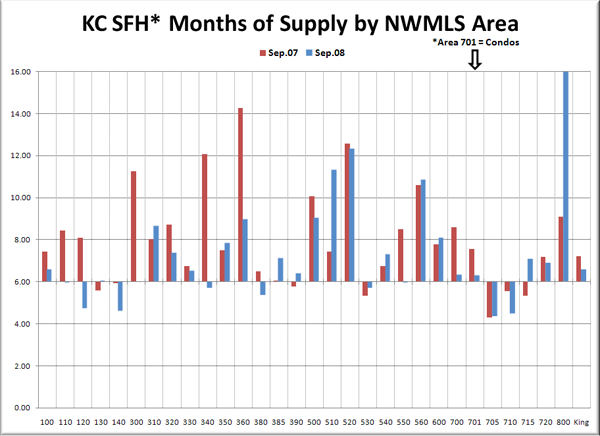
Note: Area 800 (Vashon Island) was over 17 in September, and has been clipped.
Note: MOS in area 520 (Medina, W. Bellevue) was over 19 in August, and has been clipped.
Ten of thirty King County areas were in seller’s market territory in September, ranging from 4.35 MOS in 705 (Ballard, Greenlake, Greenwood) to 5.96 MOS in 300 (Enumclaw). The city of Seattle continued to be the strongest region overall, with four of eight areas coming in below 6 MOS.
The cumulative MOS for Seattle proper increased slightly from 5.02 in August to 5.13 in September, down from 5.81 in September 2007. The Eastside as a whole decreased month-to-month to 8.03 MOS, up just barely from September 2007’s 7.97.
Here’s the bonus graph, which lets you directly compare each area’s MOS to its value one year ago. September 2007 is in red, and 2008 is in blue.
Breaking from the recent pattern, seventeen of thirty neighborhoods actually trended more toward a seller’s market than a year ago. Some of these are still in buyer’s market territory, but six areas swung from a buyer’s market in September 2007 to a seller’s market in September 2008. This was likely due largely to the spike in pending sales that we mentioned in the main NWMLS roundup. The most dramatic of these swings was in area 340 (Renton–Benson Hill), which went from 14.3 MOS last year to 5.7 this year.
The three toughest markets for sellers were Vashon Island (800) at 17.86, Medina / Clyde Hill / W. Bellevue (520) at 12.31, and Mercer Island (510) at 11.29. 520 continues its 10+ MOS streak, now at 13 months.
North Seattle neighborhoods continue to hold their title as the strongest markets in which to sell a home. The three best markets for sellers as of last month were the same as the last two months: Ballard/Greenlake/Greenwood (705) at 4.35, North Seattle (710) at 4.48, and West Seattle (140) at 4.61.
