Let’s check in on the NWMLS statistics from around the sound.
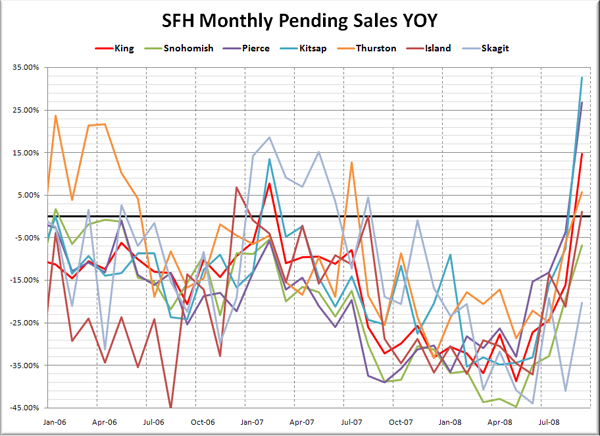
Here’s where the YOY stats stand for each of the six counties as of September 2008:
King – Price: -7.8% | Listings: +4.6% | Sales: +14.7% | MOS: 6.6
Snohomish – Price: -9.8% | Listings: -3.7% | Sales: -6.8% | MOS: 8.8
Pierce – Price: -11.6% | Listings: -9.9% | Sales: +26.7% | MOS: 7.6
Kitsap – Price: -13.9% | Listings: -3.9% | Sales: +32.7% | MOS: 7.1
Thurston – Price: -4.8% | Listings: -10.1% | Sales: +5.7% | MOS: 6.0
Island – Price: -3.4% | Listings: +1.5% | Sales: +1.1% | MOS: 12.0
Skagit – Price: -13.5% | Listings: -0.3% | Sales: -20.3% | MOS:10.4
Following below are the graphs you’ve come to expect. Click below to continue reading.
These graphs only represent the market action since January 2006. If you want to see the long-term trends, feel free to download the spreadsheet (or in Excel 2003 format) that all of these graphs come from, and adjust the x-axis to your liking. Also included in the spreadsheet is data for Whatcom County, for anyone up north that might be interested.
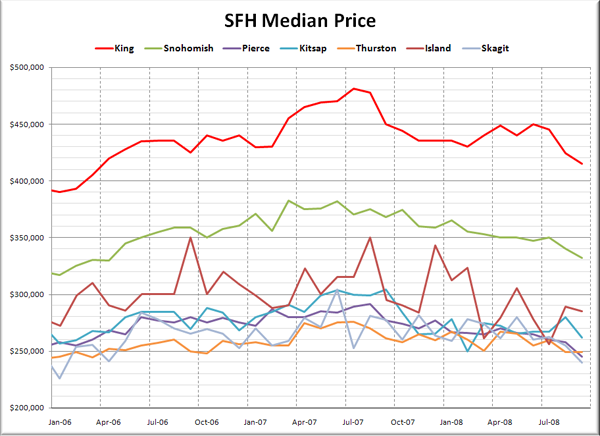
First up, it’s raw median prices.
Median prices declined from August to September in all seven Puget Sound counties, with drops ranging from $500 in Thurston to $18,000 in Kitsap.
Here’s how each of the counties look compared to their peak:
King – Peak: July 2007 | Down 13.7%
Snohomish – Peak: March 2007 | Down 13.2%
Pierce – Peak: August 2007 | Down 16.0%
Kitsap – Peak: September 2007 | Down 13.9%
Thurston – Peak: July 2007 | Down 9.8%
Island – Peak: August 2007 | Down 18.6%
Skagit – Peak: June 2007 | Down 21.1%
Thanks to the minuscule drop in September, the median price in Thurston County has now dropped the least. Note that the spreadsheet also contains a “drop from peak” graph, similar to the one posted with the monthly Case-Shiller update.
Here’s another take on Median Prices, looking at the year-to-year changes over the last two years.
Everybody’s still bouncing along in the negative, with year-over-year drops ranging from 3.4% in Island County to 13.9% in Kitsap. Interestingly, those two counties were on opposite ends of the YOY spectrum last month, with Kitsap experiencing the smallest drop, and Island the largest.
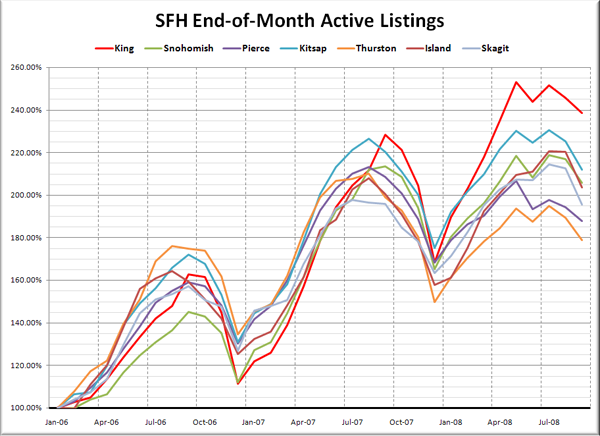
Here’s the graph of listings for each county, indexed to January 2006.
The number of listings sitting on the market declined across the board in September, with the largest month-to-month drop in percentage terms coming in Skagit, where listings fell 8% from August.
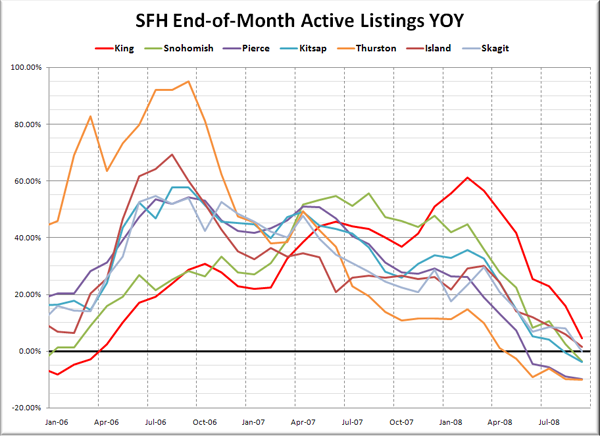
Here’s a look at the YOY change in listings.
Two more counties went YOY negative on listings, bringing the total to five of seven. King and Island are now the only Puget Sound counties where listings continue to come in higher than last year.
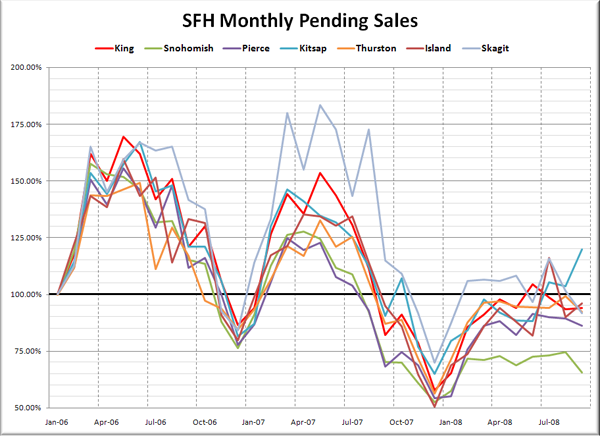
Pending sales, also indexed to January 2006:
Sales were all across the board in September, with Kitsap and Island seeing big month-to-month bumps, King staying relatively flat, and drops in Snohomish, Pierce, Thurston, and Skagit.
Lastly, here’s the YOY graph of sales:
Wow. The dramatic upward spike on the year-over-year graph is extremely noticeable in every single county, although Skagit and Snohomish simply went from really negative to somewhat less negative. It will be very interesting to see if these September sales were essentially “borrowed” from October.
Island County has had over 12 months of supply for eleven of the last twelve months. Ouch. Overall, prices declines around the sound seem to be slightly accelerating, while listings appear to have topped out. The sales spike across the entire region is definitely interesting. We will be keenly watching to see if it was just an aberration, or whether it persists into October.
