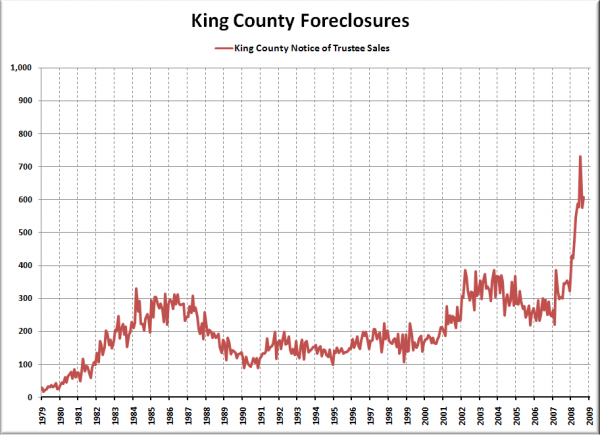
When I posted August foreclosure data from RealtyTrac last month with data going back to 2005, a complaint was aired (which I agreed with) that 2005-2008 is not sufficiently long-term. So, I spent some time with King County Records, and generated the following chart of Notice of Trustee sales going all the way back to 1979:
For the full legal definition of what a Notice of Trustee Sale is and how it fits into the foreclosure process, check out RCW 61.24.040. The short version is that it is the notice sent to delinquent borrowers that their home will be repossessed in 90 days.
As you can see, beginning in January of this year, Notices of Trustee Sales have been skyrocketing in a way not seen in the entire 30-year span of the data. They did drop significantly in August, down to 574 from 730 in July. However, they increased again in September, up to 607—a 76% increase over September 2007.
As prices continue to drop it will be interesting to see if foreclosures continue their unprecedented rapid increase.
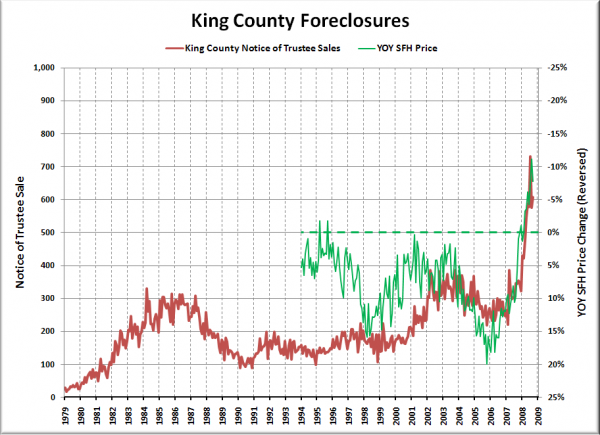
Update: I was playing around with the graph a little more and thought this was interesting enough to add. It’s the same graph as above, but with the median single-family home price year-to-year change added and flipped vertically (I only have monthly median price data back to 1993):

