Time for October market statistics from the NWMLS.
Here’s a snippet from the NWMLS press release: Housing Activity in Western Washington during October Described as "Disappointing, but Not Unexpected"
Housing activity for Northwest Multiple Listing Service members was disappointing last month, but not surprising, according to one industry executive. He and other representatives of the Northwest’s largest MLS believe the situation is improving.
Here is your summary along with the usual graphs and other updates.
Here’s your King County SFH summary:
October 2008
Active Listings: up 3% YOY
Pending Sales: down 22% YOY
Median Closed Price*: $392,000 – down 11.7% YOY
There was one particularly interesting snippet that’s outside of the usual data I include in this monthly post. Despite last month’s significant bump in pending sales (up 15% YOY), closed sales this month failed to experience a year-over-year spike, and were instead down 20% YOY. Interesting, to say the least. I’ll have more on the relationship between pending and closed sales in a later post.
Here is the updated Seattle Bubble Spreadsheet, and here’s a copy in Excel 2003 format. Click below for the graphs and the rest of the post.
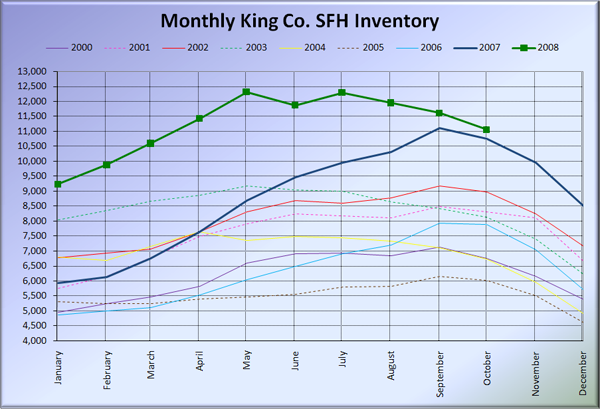
Here’s the graph of inventory with each year overlaid on the same chart.
As usual, inventory declined somewhat from September to October, but still held steady at slightly above last year’s record high levels. Since inventory is highly unlikely to rise through the end of the year, I think we can conclusively answer the April poll question about peak 2008 inventory now. The end-of-month high point this year was 12,310 in May’s report, while intra-month highs reached into the 13,000s, according to the most reliable source in the Seattle Bubble inventory tracker. So the prize goes to the 14% of you that voted 13,000-14,999, the lowest option on the poll.
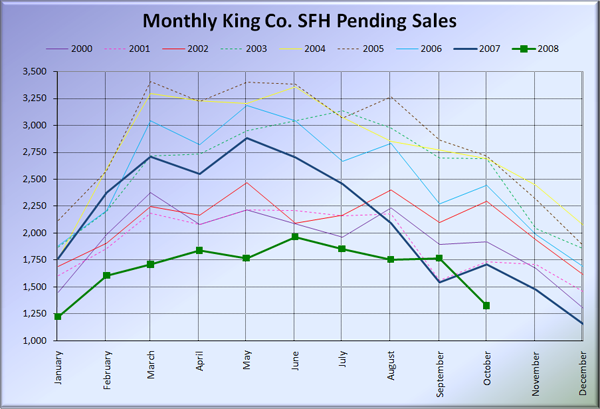
Not surprisingly, pending sales took a huge dive in October, when most years see a modest month-to-month increase in pending sales. It would appear that September’s unusual increase in pending sales was largely at the expense of October’s numbers.
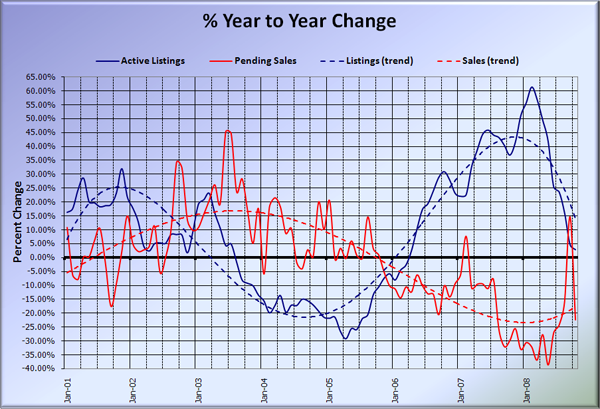
Here’s the supply/demand YOY graph.
After last month’s pending sales YOY enormous spike up, this month’s spike down was even more extreme, dropping from +15% to -22%. Yowza.
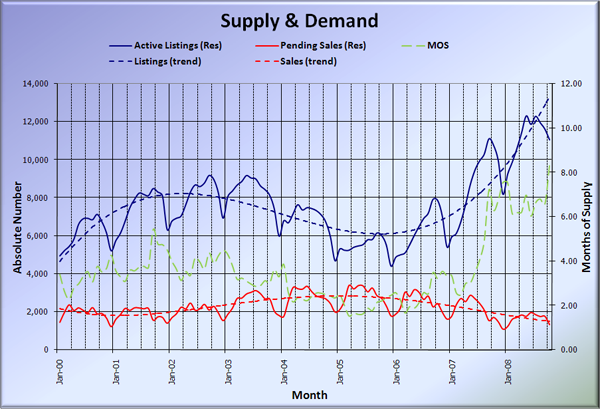
Here’s the chart of supply and demand raw numbers:
Apparently last month wasn’t the floor for King County SFH sales after all. An interesting thing to note on this graph is the Months of Supply (MOS), which broke over 8 county-wide for the first time ever in the data I have available to me. Even the sketchy data I have located back through the early 1990s puts the highest MOS in the past at around 7.
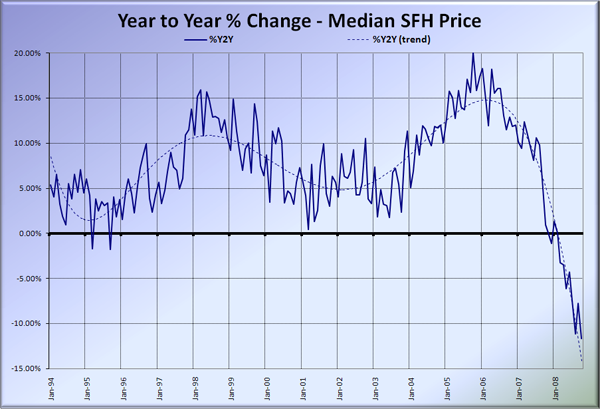
Here’s the median home price YOY change graph:
October set another new low record at a nearly 12% drop YOY.
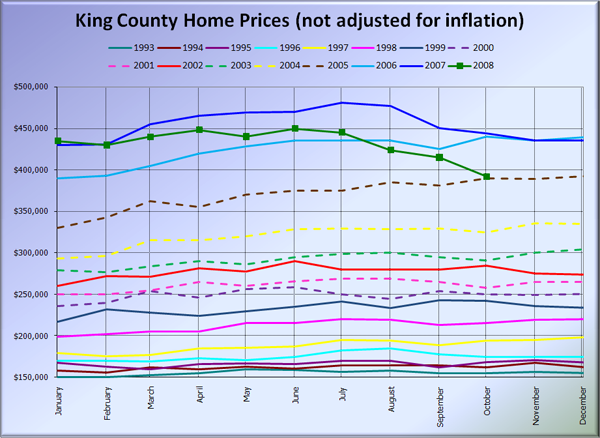
And lastly, here is my new favorite chart, comparing King County SFH prices each month for every year back to 1994.
October 2008 King County median SFH price: $392,000.
October 2005 King County median SFH price: $390,000.
Here are the news blurbs from the Times and P-I. Check back tomorrow for the full reporting roundup.
Seattle Times: Median King County house price falls below $400,000
Seattle P-I: Median house prices fall below $400,000 in King County
Wow, such originality. Apparently big round numbers make good headlines. I imagine one of them will change their headline for the full story tomorrow.
