While we wait for November sales statistics from the NWMLS, let’s take a look at a couple more charts of sales from the last few months to round out the big picture of what’s going on with local home sales.
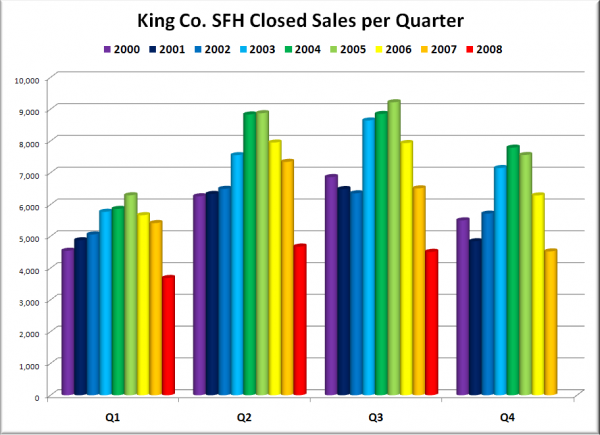
First up, here’s a look at the total closed sales by quarter, for every quarter since 2000:
The third quarter this year looked very much like the first and second quarters, with the volume of closed sales coming in far below every other year on record. With just 4,510 total SFH sales closed in King County, Q3 actually came in lower than even the worst Q4 on record, which was 2007 at 4,524.
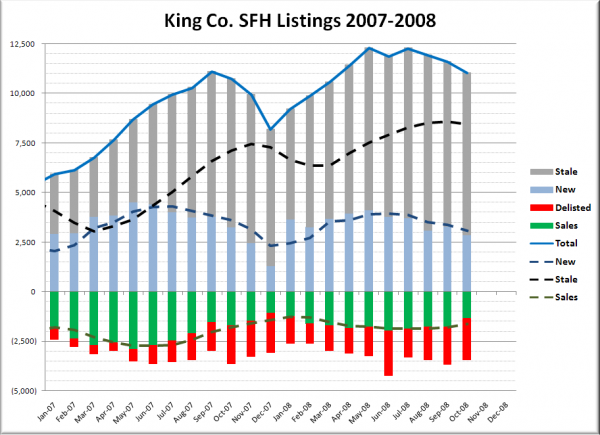
Next up, here’s an update to our listing breakdown graph, introduced and explained by Deejayoh in February this year. For historic charts of this data going back to 2001, check the ‘delisting’ tag.
The number of delisted homes (red) in October was somewhat high at 2,087, but not unprecedented for the first full month of fall. 2000-2002 saw similar numbers of delisted homes in October as well. In October last year, as we headed into the slow season, the market had 7,493 “stale” listings. This October there were 8,196 “stale” listings, a 9.4% increase.
Another thing that is somewhat interesting is that the number of homes delisted in October exceeded the number of homes sold by 760. That never happened from January 2003 through September 2007, when monthly sales exceeded delistings by an average of 1,786. Since October last year, delistings and sales have been relatively even.

